As crazy as it may sound, data from space can be extremely helpful in fighting disease on Earth. How exactly are earth observation and infectious diseases related?
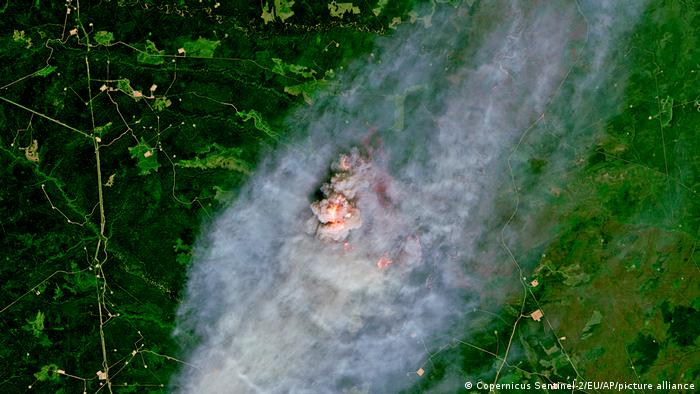
From the destruction of forests researchers can derive a prognosis for the probability of virus transmission
I'll admit it: When the word came up that I should go to this year's Living Planet Symposium, which the European Space Agency (ESA) is hosting on the subject of Earth observation satellites, I was moderately enthusiastic. Even the word “earth observation satellites” is so unwieldy that I thought the topic was only interesting for – in the truest sense of the word – spaced-out fans and experts.
However, I had to realize that earth observation obviously has a large fan base. ESA counted 4700 registrations for the five-day symposium and visitors are spoiled for choice between more than 240 individual events. These included several presentations on the use of satellites to research and combat infectious diseases such as cholera, influenza or the zoonotic disease Ebola. That sounded so crazy that I got curious.
The person who brought the satellite and space research topic out of the infinite expanse of space and brought it very close to the audience listening at the opening event was, of all people, an astronaut. Alexander Gerst told how it feels to look at the planet from above.
Forest fires, cloud formations, the glow of big cities at night, huge river deltas. “Suddenly, when you see this big picture, so much becomes clear,” said Gerst.
According to the motto: sometimes it helps to look at the big picture to get a closer look at the details. It is precisely this approach that researchers use when they use the images and numbers from earth observation satellites for their work.
Destructed forest, more Ebola
Larisa Lee-Cruz from the French agricultural research center CIRAD presented a study in which the researchers used data from earth observation satellites such as Sentinel to find out how the Ebola virus was transmitted. Overall, Lee-Cruz says knowledge about the extremely deadly bat-borne infectious disease is still poor.
However, by comparing satellite images from different regions in West and Central Africa, the researchers are fairly certain that Ebola breaks out particularly often in areas where large forest areas used to be fragmented or completely destroyed and instead used for agriculture.
The satellite images the scientists used show forest shrinking in an area of around 190 km² in Guinea over a period of ten years. It is data that the researchers can integrate into their investigations into the life and behavior of bats and the risk of virus transmission to humans.
“With the help of Earth observation, we can not only track changes in vegetation , but also temperatures and the level of air pollution,” says Rochelle Schneider, who researches the use of artificial intelligence in Earth observation at ESA. She is particularly interested in how satellite data can be used in healthcare.
Another natural event that satellite data can provide information on can have a massive impact on human health: floods.
Cholera and diarrhea
785 million people worldwide have no access to clean water. For example those people who live at Lake Vembanad in the state of Kerala in India. With a length of around 100 km, Lake Vembanad is the second largest lake in the country. And a real mess.
The water, heavily polluted with heavy metals, pesticides and microplastics, is nevertheless a tourist attraction and the livelihood of many people. In 2018, a particularly heavy monsoon led to a flood of the century – 500 people died and over a million people lost their homes. Floods also often lead to so-called “waterborne diseases”.
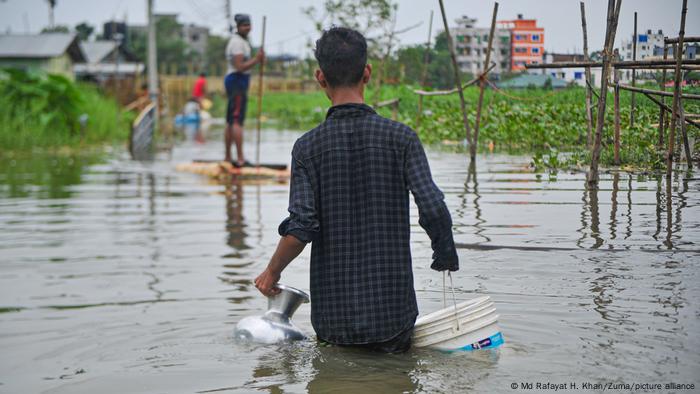
Predicting flooding from satellite data can be extremely helpful. If appropriate action is taken
In addition to cholera, diarrheal diseases caused by bacteria such as Escheria coli (E. coli) are the cause of death for around 1.5 million people a year. The spread of E. coli and the resulting diseases are strongly correlated with rainfall, says Manuela Grippa from the Géosciences Environment Toulouse (GET) in France.
Together with researchers from Burkina Faso, Grippa used satellite data to estimate precipitation levels. In addition, the scientists examined collected water samples and evaluated epidemiological data on the spread of diarrheal diseases in the region.
A lot of knowledge, not enough will?
“Satellite data is a great help, especially in regions where there are few other options for collecting health and environmental data,” explains ESA's Rochelle Schneider.
After two days at the Living Planet Symposium, Earth observation satellites strike me as extremely useful diagnostic tools, constantly monitoring and surveying the planet.
Like a patient whose heart attack might be predicted by the close monitoring, can the satellite data provide valuable information about imminent disasters such as floods.
However, in order to actually be able to prevent the disaster, whether it is a heart attack or a flood, measures are necessary. In the case of the planet, these are primarily climate protection measures.
So whether there is actually a lack of knowledge and data when answering the question of how we can maintain a healthy planet worth living in for all people, or whether there is not much more political will to act – I don't have a satisfactory answer to that at the Living Planet Symposium obtained.
-
 Earth Observer Sentinel-1: Satellites with Radar View
Map Ground Movements
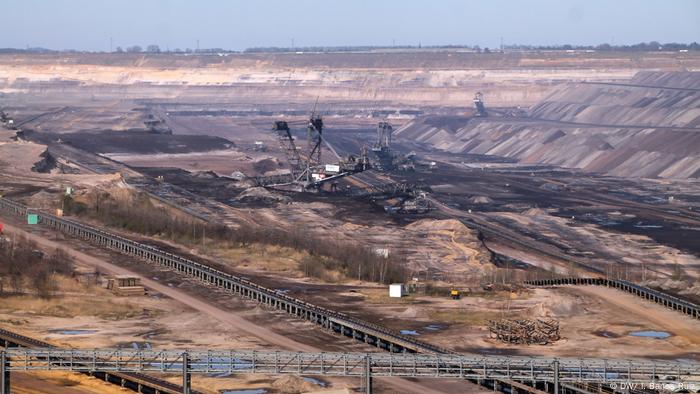
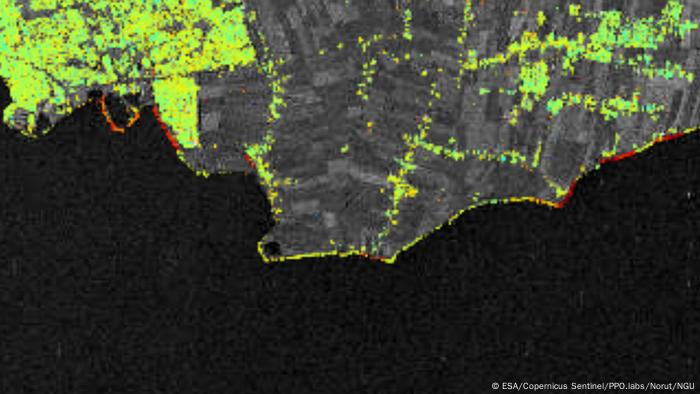
You don't need a satellite image to see that things are changing here. But the radar images from the Copernicus mission Sentinel-1 provide more clarity. The deformation of the earth's surface is often due to changes that take place largely underground – for example due to groundwater extraction, the natural compaction of sediments, urbanization or, in this case: mining.
-
 Earth observer Sentinel-1: Satellite with radar view
An overview with millimeter precision
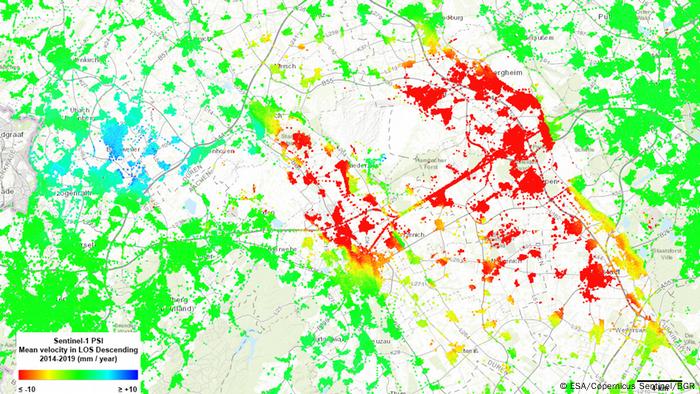
This map shows how the land surface in the Rhenish area shifted by millimeters every year between 2014 and 2019. The lowering shown in red is clearly due to opencast lignite mining with simultaneous groundwater lowering. The bruises in the adjacent area are probably related to the rise in groundwater after mining stopped.
-
 Earth observer Sentinel-1: Satellite with radar sight
Earth observation for everyone< /h2>
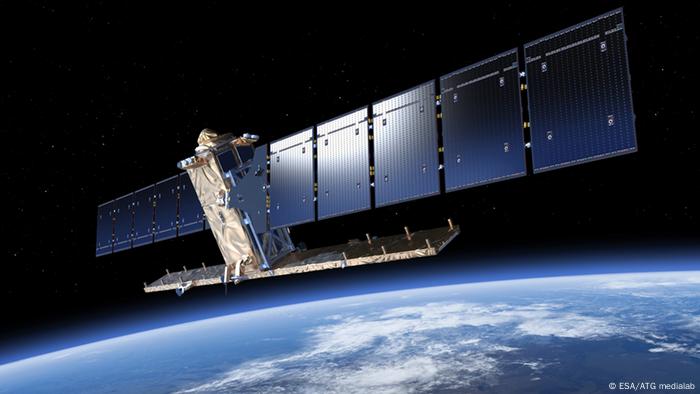
The fact that Sentinel-1 has mapped tiny shifts in the land surface for all of Germany is new. In the service of science, however, the mission has been on the road for a long time: Sentinal-1A was launched in 2014, Sentinel-1B followed in 2016. Since then, they have been collecting data that is accessible to everyone and for the areas of environment, climate impact research, transport, economy and security
-
 Sentinel-1 Earth Observer: Satellite with radar sight
Reductions from salt mining
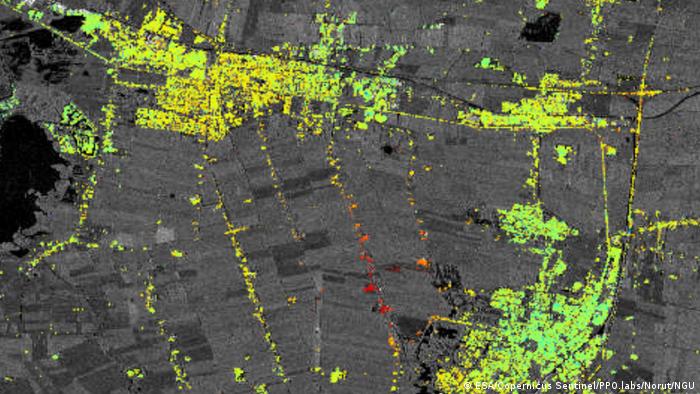
This image is based on data from 2014 to 2016. It shows surface deformations caused by salt mining around Veendam near Groningen (Netherlands). Green dots indicate where the country is stable. Orange and red represent subsidence of the earth's surface.
-
 Earth observer Sentinel-1: Satellite with radar sight
Tremors and landslides
Such ground movements are not only due to salt mining in the Netherlands. Landslides or tremors can also occur as a result of hard coal mining, as here in Witten in the Ruhr area. Such man-made mini-earthquakes can cause dangerous damage to buildings in both urban and rural areas.
-
 Earth observer Sentinel-1: Satellite with radar sight
Vulnerable Shores
The images taken from space can be useful for authorities to improve city planning or even to spot problematic subsidence before it is visible to the naked eye. Here you can see subsidence along the Markermeer in the Netherlands. These areas are shown in red, while the green areas show where the ground is stable.
-
 Earth observer Sentinel-1: satellites with radar view
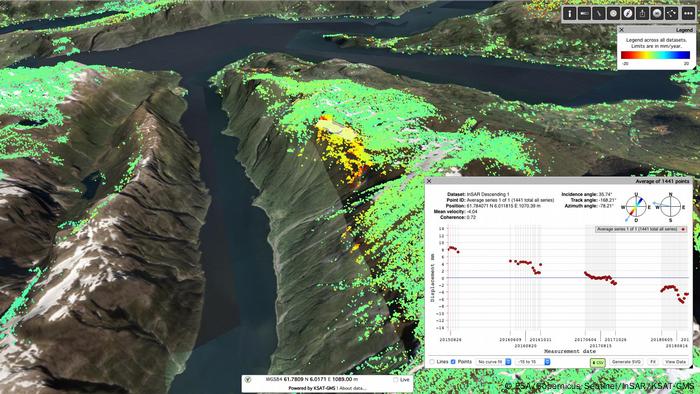
Mountain in motion
Osmundneset, located on the east side of Norway's Hyenfjord, is a large unstable rock face. The dark red dots correspond to a subsidence of up to two centimeters between 2015 and 2018. The green dots show negligible movement. Researchers want to understand the geological conditions and risks in order to set up a 24/7 early warning system if necessary.
-
 Earth observer Sentinel-1: satellites with radar sight
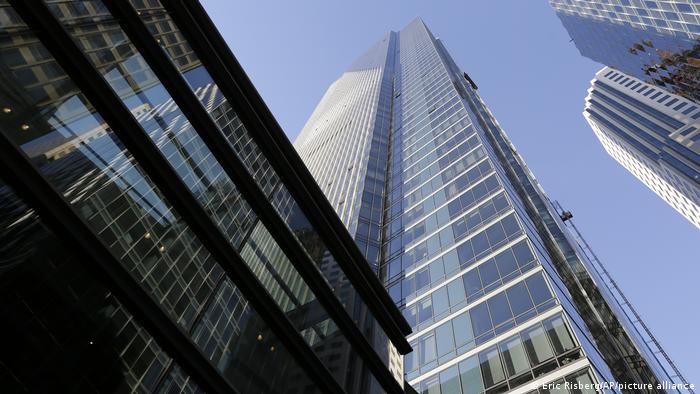
Aiming high?
No, it's going down! The Sentinel-1 satellites have shown that the Millennium Tower in central San Francisco is sinking a few inches each year. The scientists can use the satellite data to monitor urban ground movements. There are also such subsidence hotspots in Europe.
-
 Earth observer Sentinel-1: Radar View Satellites
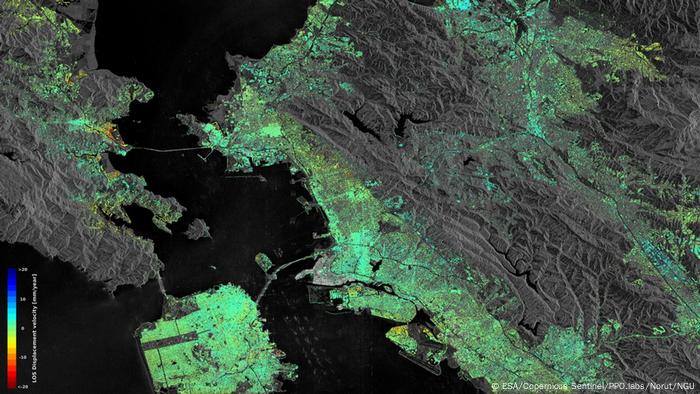
Locate displacement hotspots
The geologists have also mapped other parts of San Francisco, such as the buildings along the seismic Hayward Fault zone at right. On the left you can see that land reclaimed from the sea is sinking in San Rafael Bay (yellow,orange). A land uplift can be seen in the lower right. The water table there is probably recovering after a four-year drought (data from 2015 to 2016).
-
 Earth observer Sentinel-1: satellites with radar sight
Train station in motion
Sentinel-1 data collected between December 26, 2014 and October 28, 2016 shows that parts of the Oslo train station are sinking by 10-15 millimeters per year. This corresponds to a vertical subsidence of 12-18 millimeters per year. It is also easy to see that the opera house – the white building on the fjord south of the subsidence area – has not moved.
-
 Earth observer Sentinel-1: satellites with radar vision
New Sentinel member
It's not just the Sentinel-1 pair that are part of the Earth observation program, meanwhile are satellites up to the suffix “-6” in orbit. The newest member of the family started on November 21st. With the help of “Sentinel 6 Michael Freilich”, researchers want to take a closer look at the oceans from space in order to measure and map the rise in sea level.