

A what-if scenario is fairly easy to understand – put simply, your question is, “If this happens, what happens to my numbers, or bottom line? In other words, if we do $20,000 worth of sales over the next few months, how much profit will we show?” At its basest form, this is what What-If Analysis is designed to do – projections.
As with most everything else in Excel, this feature is robust. It allows you to perform everything from relatively simple What-If projections to highly sophisticated scenarios. And, as is usually the case with Excel features, there’s no way I can cover all the possibilities in this short tutorial.

Instead we’ll look at the basics today, and I’ll provide you with a few relatively easy What-If concepts to get you started.
Making Basic
Projections


As you probably know, in the right hands, the right set of numbers can be manipulated to say just about anything. You’ve undoubtedly heard this expressed in all sorts of ways, such as Garbage in, garbage out. Or perhaps Projections are only as good as their presumptions.
Excel provides many, many ways to set up and use What-If Analysis. So let’s look at a fairly simple and straightforward projection method, Data Tables. This method enables you to see how changing one or two variables, such as, say, how much taxes you pay, affects your business’s bottom line.
Two other significant concepts are Goal Seek and Excel’s Scenario Manager. With Goal Seek, you try to project what has to happen for you to achieve a predetermined objective, such as, say, making a million-dollar profit, and Scenario Manager allows you to create and manage your own collection of What-If (and other) scenarios.
The Data Tables Method – One Variable
To get started, let’s create a new table and name our data cells. Why? Well, this allows us to use names in our formulas, rather than cell coordinates. Not only can this be useful – much more exact and accurate – when working with large tables, but some people (including me) find it easier.
In any case, let’s start with one variable and then move on to two.
- Open a blank worksheet in Excel.
- Create the following simple table.

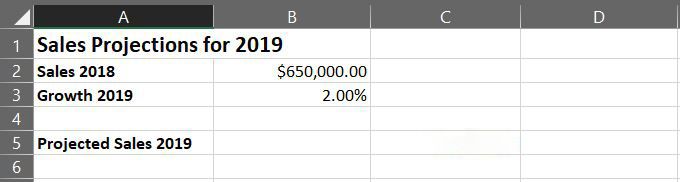
Note that to create the table title in Row 1, I merged cells A1 and B1. To do so, select the two cells, then, on the Home ribbon, click the Merge & Center down-arrow and choose Merge Cells.
- Okay, now let’s name cells B2 and B3. Right-click cell B2 and choose Define Name to bring up the New Name dialog box.
As you can see, New Name is straightforward. As for the Scope drop-down, this lets you name the cell relative to the entire workbook, or just the active worksheet. In this case, the defaults are fine.

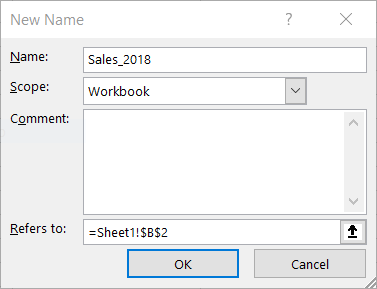
- Click OK.
- Name cell B3 Growth_2019, which is also the default, in this case, so click OK.
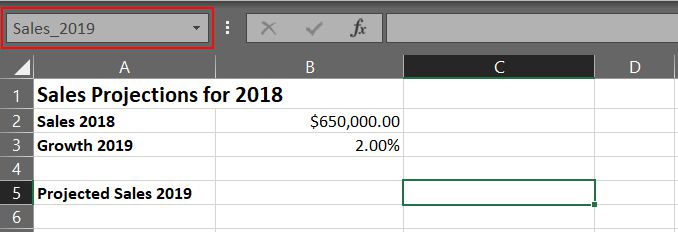
- Rename cell C5 Sales_2019
Now notice that if you click any of these cells you named, the name, instead of the cell coordinate, shows up in the Name box (outlined in red below) in the upper-left corner above the worksheet.

To create our What-If scenario, we need to write a formula in C5 (now Sales_2019). This little projection sheet allows you to see how much money you’ll make by percentage of growth.
Right now, that percentage is 2. To get different answers based on varying percentages of growth, when we finish the spreadsheet, you’ll simply change the value in cell B3 (now, Growth_2019). But I’m getting ahead of myself.
- Enter the following formula in cell C5 (outlined in red in the image below):
=Sales_2018+(Sales_2018*Growth_2019)

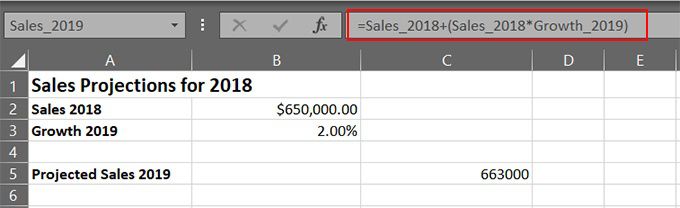
When you finish entering the formula, you should get the projected number in cell C5. You can now project your sales based on a percentage of growth by simply changing the value in cell B3.
Go ahead and try it. Change the value in cell B3 to 2.25%. Now try, 5%. Are you getting the idea? Simple yes, but can you see the possibilities?
The Data Table Method – Two Variables
Wouldn’t it be terrific to live in a world where all your income is profit – you have no expenses! Alas, that’s not the case; therefore, our What-If spreadsheets aren’t always so rosy.
Our projections also need to take into account our expenses. In other words, your projection will have two variables: income and expenses.
To set that up, let’s start by adding another variable to the spreadsheet we created earlier.
- Click in cell A4 and type Expenses 2019, like this:

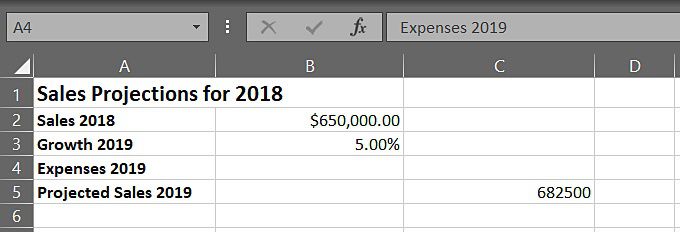
- Type 10.00% in cell B4.
- Right-click in cell C4 and select Define Name from the pop-up menu.
- In the New Name dialog box, click in the Name field and type Expenses_2019.
Easy so far, right? All that’s left to do is modify our formula to include the value in cell C4, like this:
- Modify the formula in cell C5 as follows (add *Expenses_2019 at the end of the parenthetical data.)
=Sales_2018+(Sales_2018*Growth_2019*Expenses_2019)
As I’m sure you can imagine, your What-If’s can be much more elaborate, depending on several factors, including the data you include, your formula-writing skills, and so on.
In any case, now you can make projections from two perspectives, income (Growth) and Expenses. Go ahead and change the values in cells B3 and B4. Plugin your own numbers and give your little What-If worksheet a spin.
Additional
Studies
As with almost everything else you can do in Excel, you can take this What-If Analysis feature to some rather elaborate scenarios. In fact, I could write several articles on projection scenarios and not even come close to covering the topic in detail.
Meanwhile, here are a few links to some more elaborate What-If scripts and scenarios.
- What-If Analysis: This well-illustrated how-to looks at, among other things, Excel’s Scenario Manager, where you can create and manage your own collection of What-If (and other) scenarios.
- Introduction to What-If Analysis: Here’s the Microsoft Office Support site’s introduction to What-If Analysis. There’s lots of information here with links to a slew of useful What-If instructions.
- How to use Goal Seek in Excel for What-If analysis: Here’s an introduction to Excel’s Goal Seek What-If Analysis feature.