Zen 4 with 3D V-Cache is here. As the first representative of its kind, the AMD Ryzen 9 7950X3D has to assert itself in the test against Ryzen 9 7950X, Ryzen 7 5800X3D and Intel Core i9-13900K(S) in games and applications. With both the GeForce RTX 4090 and the Radeon RX 7900 XTX, it leaves the field as the winner in games with low consumption.
Table of contents
- 1 King of the Gaming Hill
- Ryzen 7000X3D with 3D V-Cache in review: Zen 4 for gamers
- Ryzen 7950X3D, 7900X3D and Ryzen 7 7800X3D in detail
- Gaming benchmarks on two high-end GPUs
- Game benchmarks in 720p on the GeForce RTX 4090
- Game benchmarks in 720p on the Radeon RX 7900 XTX
- Scheduling: In the test, all games ran on the 3D V-Cache die
- The power consumption in games (RTX 4090)
- The clock rates in games (RTX 4090)
- 2 CCD scheduling and RAM OC analysed
- AMD's CCD allocation in the analysis
- Memory tuning is as effective as before
- 3 Performance in applications, setup and conclusion
- Performance and efficiency in applications
- Installation and everyday use
- Conclusion
Ryzen 7000X3D with 3D V-Cache Review: Zen 4 for Gamers
The Ryzen 7 5800X3D (test) was a complete success in spring 2022. With the 3D V-Cache used for the first time, AMD was able to significantly improve the gaming performance of the Zen 3 compared to the processor without an additional cache. The CPU caught up with more expensive flagships from Intel. The Ryzen 7 5800X3D breathed new life into the AM4 platform at the end of its multi-year term and many gamers were aware: AMD Ryzen will only be an X3D variant in the future.
 AMD Ryzen 9 7950X3D Review
But Ryzen 7000 was launched in autumn 2022 without X3D variants for the time being. Although the Ryzen 7000 based on Zen 4 (test) has also increased significantly compared to the previous generation, even the flagship Ryzen 9 7950X did not achieve higher gaming performance than the Ryzen 7 5800X3D in most tests. This means that Ryzen 7000 at the upper performance end has been “at a disadvantage” in games compared to Intel's Raptor Lake generation, which comes in the form of Core i9-13900(K(S)/F), Core i7-13700(K/F) and Core 5-13600K made a big leap thanks to significantly increased clock speeds.
Ryzen 7950X3D, 7900X3D and Ryzen 7 7800X3D in detail
That is about to change, because AMD is now also letting the 3D V-Cache for Zen 4 into the wild and in In contrast to the last generation, three correspondingly equipped products are appearing.
Two Ryzen 9 with X3D today, one Ryzen 7 in April
< p class="p text-width">Ryzen 7 7800X3D, Ryzen 9 7900X3D and Ryzen 9 7950X3D should all three improve significantly in games compared to the well-known Ryzen 7000 and also leave Intel's Core 13000 line-up behind. However, the smallest model and thus the quasi-successor of the Ryzen 7 5800X3D is still a long time coming, because AMD first only sends the 789-euro flagship Ryzen 9 7950X3D (699 US dollars before taxes) to the test and parallel to that before taxes The Ryzen 9 7900X3D, which costs 679 euros (599 US dollars before taxes), will be available in stores: both will be released on February 28, 2023. AMD has only sampled the large Ryzen 9 in Germany.
 AMD Ryzen 9 7950X3D Review
The Ryzen 7 7800X3D is expected to go on sale from April 6 for $449 (EUR price not yet known). ComputerBase will retest the two missing processors when available.
On paper, the X3D take it variants and the respective non-X3D sister models are priced at nothing or very little. Since the regular Ryzen 7000(X) are now sometimes listed well below the RRP, there will be a significant surcharge in retail at the start. How long the price differences will last in the market will depend on how players respond.
- Ryzen 9 7950X3D & Buy 7900X3D at Alternate*
- Ryzen 9 7950X3D & Buy 7900X3D at Caseking*
- Ryzen 9 7950X3D & Buy 7900X3D at Mindfactory*
- Ryzen 9 7950X3D & Buy 7900X3D at notebooksbilliger.de*
Known approach, new challenge
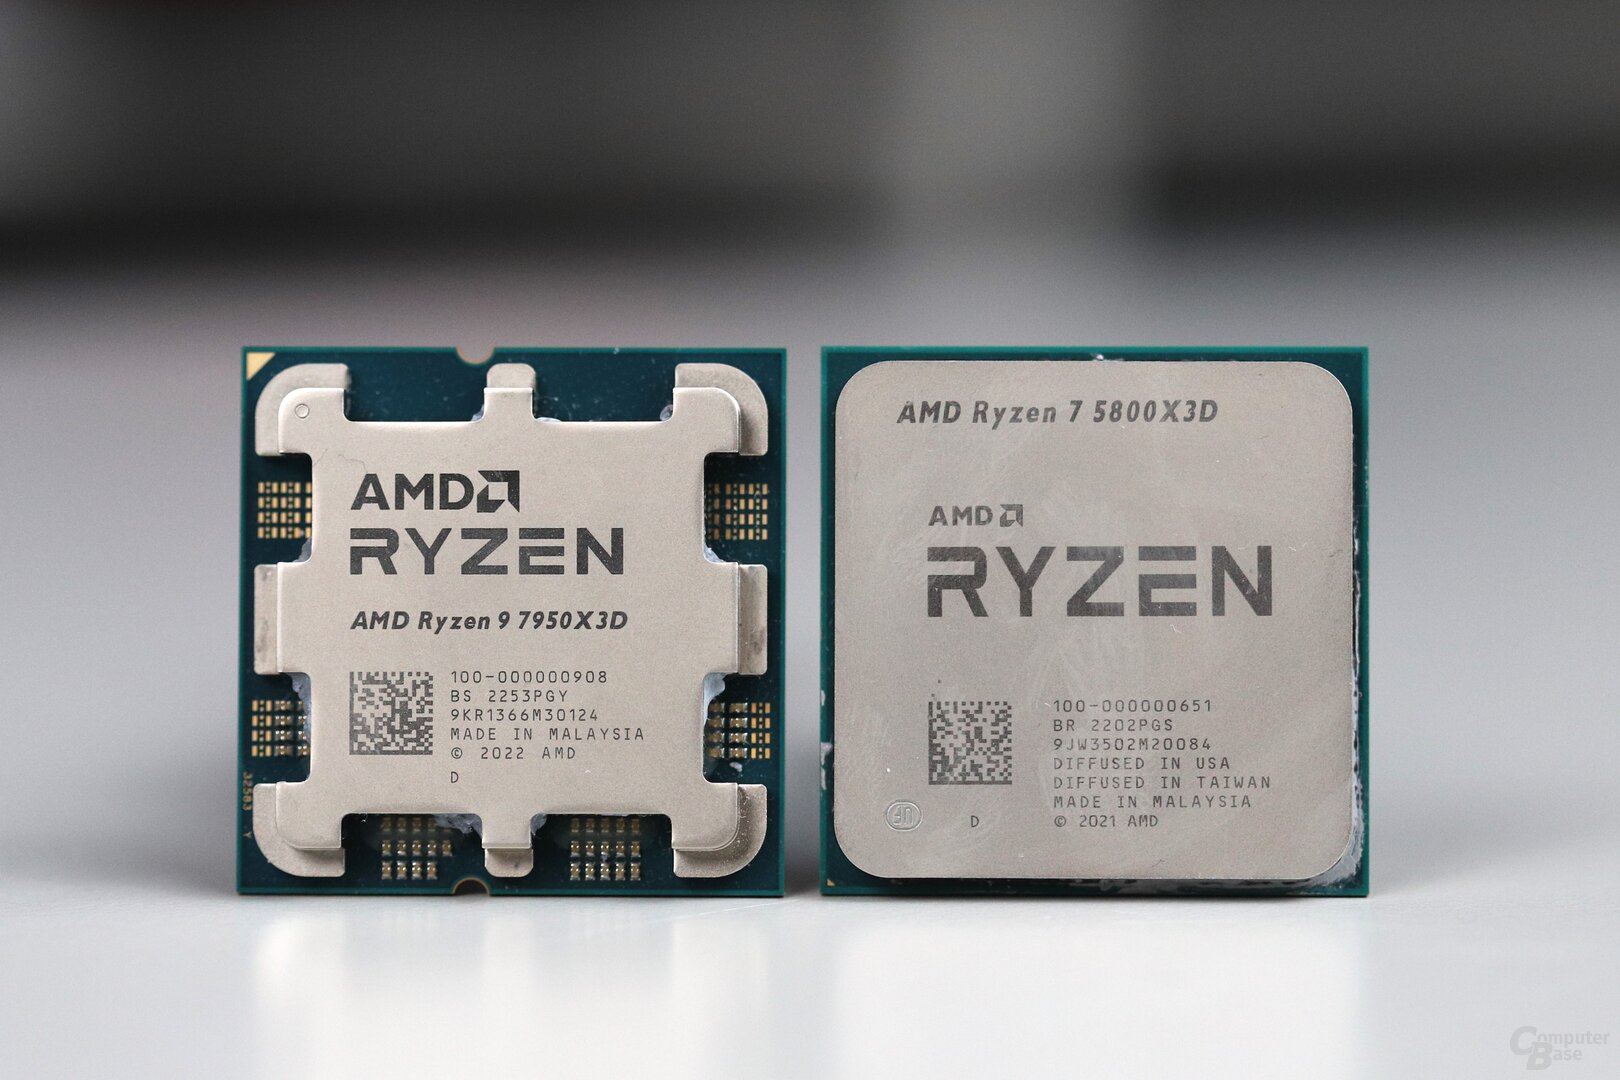
The technical approach that AMD takes with the X3D variants is known from the Ryzen 7 5800X3D launch model: The 3D V-Cache placed on the chiplet is again 64 MB in size, as in the Ryzen 7 5800X3D, and the latency is also the same. “The chiplet” is to be taken literally in this generation, however, because even with the Ryzen 9 7950X3D and Ryzen 9 7900X3D, which, in contrast to the Ryzen 7 7800X3D, have two chiplets, the additional L3 cache die is only located on one of the two CCDs .
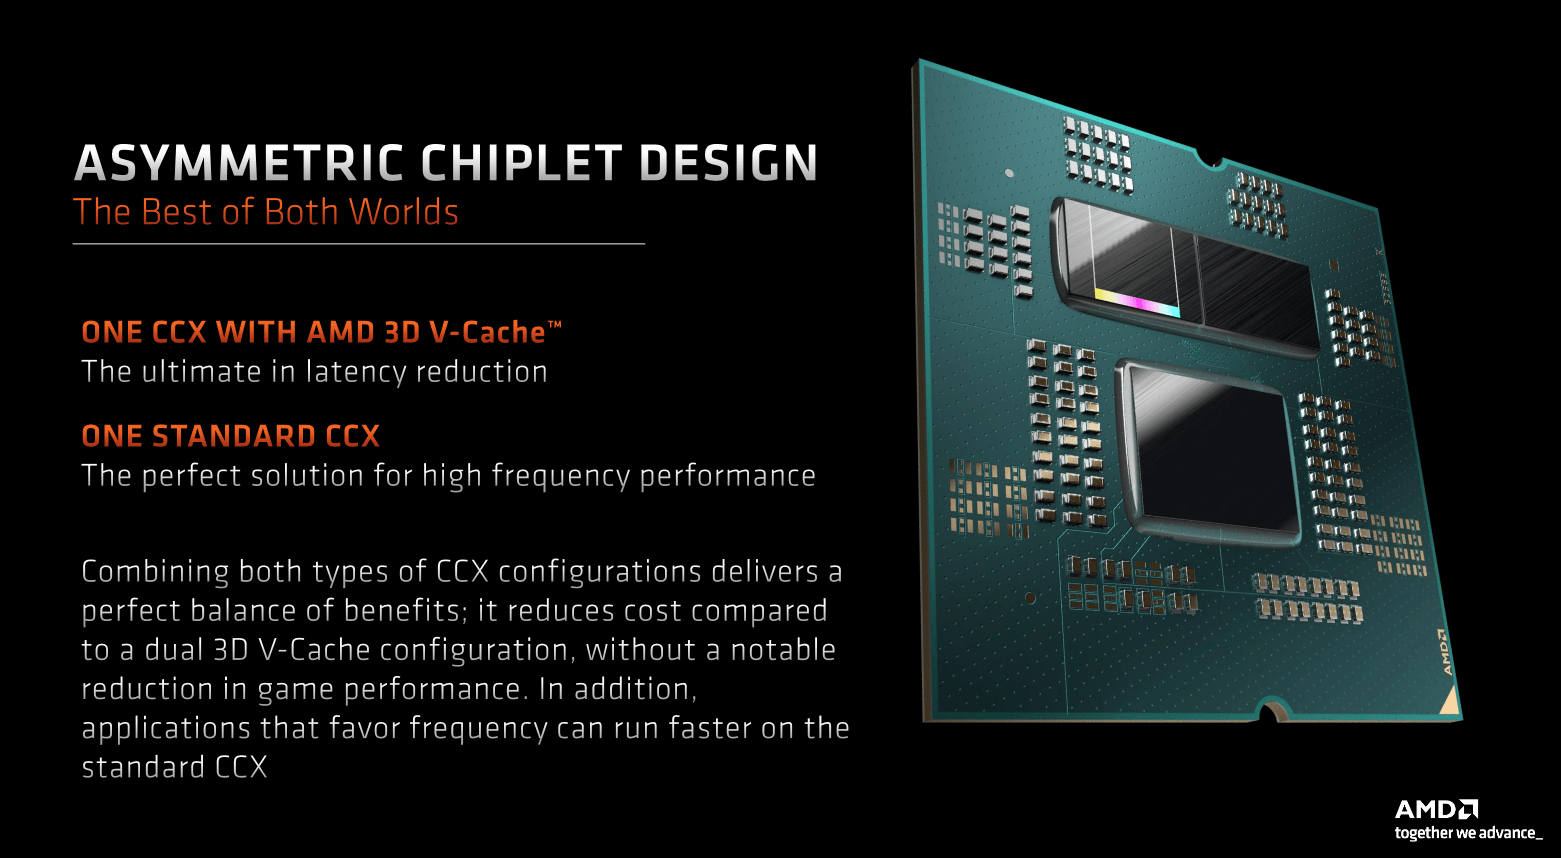 AMD promises the best of both worlds ( Image: AMD)
Even after the announcement for CES 2023, it was clear among enthusiasts: The real challenge in this generation will be the interaction of the two different CCDs on the Ryzen 9, one of which carries the cache and therefore clocks slower, the other the same clock rates as that respective X base model.
AMD had kept the maximum clock of the 3D V-Cache dies of the Ryzen 9 under wraps until recently. The Ryzen 7 7800X3D was already known to be 400 MHz below the 5.4 GHz of the Ryzen 7 7700X, and the assumption was correct suggests that this clock applies to all 3D V-Cache dies in the series. But that's not the case. The sample of the Ryzen 9 7950X3D was able to achieve up to 5,275 MHz in games in the editorial test, i.e. clocked at almost 5.3 GHz, which also means a reduction of 400 MHz compared to the 5.7 GHz of the regular die of the same CPU. The editors do not yet have their own findings for the Ryzen 9 7900X3D.
So should a thread that only little or not at all from the 3D V-cache profits, landing on the cache CCD, it would face a clock disadvantage of about 400 MHz or 7 percent on the Ryzen 9 7950X3D.
If, on the other hand, all 16 cores and 32 threads are used under full load in parallel applications, both CCDs clock more or less the same and “thanks” to the TDP of 120 watts and the associated PPT of 162 watts, the 7950X3D clocks at less than 5.0 GHz, what also beats the maximum 3D cache clock. In this case, it makes no difference which thread runs on which CCD – the minimal differences in the clock rates documented below also show the regular X and non-X CPUs.
Clock curve in Blender 01.0002.0003.0004.0005.0006. 000MHz 15101520253035404550556065707580859095100105110115120125129
- AMD Ryzen 9 7950X3D – CCD0
- AMD Ryzen 9 7950X3D – CCD1
AMD's solution to ensure that threads do not end up on the wrong CCD when the CPU is not fully loaded is an adapted chipset driver including the AMD 3D V-Cache Performance Optimizer Driver in version 1.0.0.7 and new BIOS versions. In addition, Windows 10 or Windows 11 and the Xbox Game Bar app should be up to date. How exactly it is then decided in the background which load clocks on which core, the manufacturer still did not want to go into detail. The first CPU die with an additional cache, but with less clock speed, is used for games. Regular applications start at thread 16, which is the second CCD with a higher clock.
One finding from the tests with the Ryzen 9 7950X3D over the past few days in terms of so-called “scheduling” is definitely: it works! Fears expressed in advance that a suboptimal allocation could be the order of the day with the Ryzen 9 have not come true. More on that later in the test.
Gaming benchmarks on two high-end GPUs
How much the Ryzen 9 7950X3D can benefit from the 3D V-Cache CCD and how well the thread assignment works was tested by the editors with a completely new course and test approach.
Specifically, the Ryzen 9 7950X3D had to compete in a total of 14 games, including brand new titles such as Dead Space and Forspoken, against the variants without a 3D cache, against the Ryzen 7 5800X3D and of course against Intel's Raptor Lake generation from the Core i5-13600K to compete with the Core i9-13900KS. It was not only tested on the lightning-fast Nvidia GeForce RTX 4090 (test), but also on the AMD Radeon RX 7900 XTX (test).
But the article will not only cover the gaming topic, application performance will also be examined. There, the focus is also on differences in efficiency compared to the regular version, because here the Ryzen 9 7950X3D may have advantages over the Ryzen 9 7950X.
All gaming benchmarks were rebuilt
In order to evaluate gaming performance as accurately as possible, all gaming benchmarks have been recreated for this article. A total of 14 current games from Dead Space to Forspoken, The Callisto Protocol and The Witcher 3 to multiplayer titles such as Dota 2 or Fortnite are in the benchmark. Ray tracing was sometimes used when this additionally increased the CPU load.
AMD Ryzen 7 7700X, Ryzen 9 7900X, Ryzen 9 7950X, Ryzen 7 5800X3D and Ryzen 7 5800X as well as Intel Core i5-13600K, Core i7-13700K, Core i9-13900K and Core i9-13900KS had to deal with both the Radeon RX 7900 XTX as well as with the Nvidia GeForce RTX 4090 against the new AMD Ryzen 9 7950X3D.
 AMD Ryzen 9 7950X3D review
Game selection, test system and drivers
Since ComputerBase worked with several editors and test systems on the Ryzen 7000X3D tests, the settings and test procedures differ in detail. In the gaming benchmarks, all CPUs work according to the factory specifications from AMD and Intel, unless explicitly stated otherwise. The memory expansion was always 32 GB, while the memory configuration differed. Ryzen 7000, whether with 3D cache or without, were driven with DDR5-5200 32-32-32-61, Intel Core 13000 on the other hand with DDR5-5600 32-32-32-61. RAM OC benchmarks were also performed.
As the mainboard for the Ryzen 7000, the editors chose the Asus Crosshair X670E Hero with BIOS version 0805 for the normal Zen 4 CPUs and BIOS 9922 for the X3D offshoots, while the Ryzen 7 5800 and the Ryzen 7 5800X3D Asus ROG Crosshair VIII Hero with BIOS 4304 and Intel processors on Asus ROG Z790 Maximus Hero with BIOS version 0813.
For the test, Windows 11 is used in the current version 22H2 with all updates, all drivers including those for the chipset are up to date. As is usual with Windows 11 on modern systems with current BIOS versions, the core isolation (VBS) plus memory integrity ( HVCI) activated automatically.
The game selection
A total of 14 different games took part in the test, some of which support ray tracing. Ray tracing was used when the rays create a higher CPU load in the game. Otherwise the feature remained switched off.
In order to shift the load from the graphics card to the processor as much as possible, all benchmarks were carried out in 1,280 × 720. In addition, upsampling was used whenever possible (be it through AMD FSR or in-game variants) to further reduce GPU load. Although this is not realistic, further resolutions would increase the workload too much without glaring differences – the editors preferred to invest the additional time in detailed analyses. An AMD Radeon RX 7900 XTX as a reference design with Adrenalin driver 23.1.2 and an Nvidia GeForce RTX 4090 Founders Edition with GeForce driver 528.24 were used as graphics cards.
The exact graphics settings of the games can be found in the table below. In addition, if available, the ComputerBase technology test is linked to find out more information about the respective PC version.
RT Resolution “High”, RT Geometry “Very High”, RT View Distance “10 The Callisto Protocoll Ultra Preset, FSR 2 “Performance” The Witcher 3 Maximum Graphics Details (“Highest+”), Hair Works “Off”, no RT, FSR 2 “Ultra Performance” Uncharted: Legacy of Thieves Ultra Preset, FSR 2 “Ultra Performance”
Even if the games are mostly used in graphics card tests or there are individual technical tests, this does not necessarily mean that the same test sequences are used. Because with these, ComputerBase usually selects sequences with low frame rates that put a maximum load on the graphics card. But that doesn't make sense for this article, we were looking for test sequences with a high CPU load. This was the case in Forspoken, Spider-Man Remastered and The Witcher 3. A direct comparison is therefore not always possible.
Game benchmarks in 720p on the GeForce RTX 4090
AMD did it: The AMD Ryzen 9 7950X3D delivers an average of 4 percent more average FPS than the Core i9-13900K and 3 percent more FPS than the Core i9-13900KS on a GeForce RTX 4090 in games – there is a faster gaming CPU currently not in this course. AMD's new flagship is also ahead in the percentile FPS, the lead is slightly smaller here.
Compared to the Ryzen 9 7950X with the same architecture but without the cache chiplet, the new CPU delivers 19 percent more FPS. This means that the plus is smaller than that of the Ryzen 7 5800X on the Ryzen 7 5800X3D in the same course, which is 26 percent. However, it is quite possible that the limitations have shifted due to the generally higher performance of the new Ryzen 9, because the Ryzen 9 7950X3D is at least a good 25 percent faster than the Ryzen 7 5800X3D. In addition, the Ryzen 7 5800X3D was only 15 percent more powerful than the “cache brother” when it was launched in April 2022 in a different course with a different graphics card. With time and other games, the difference will probably increase in the new generation.
Performance rating, RTX 4090
- AVG FPS
- Percentile FPS
Edit Performance rating, RTX 4090 – AVG FPS Inflow charts All None
- Age of Empires 4 – 1280×720, RTX 4090: FPS, Average
- Call of Duty Warzone 2 – 1280×720, RTX 4090: FPS, Average
- Cyberpunk 2077 + RT – 1280×720, RTX 4090: FPS, Average
- Dead Space – 1280×720, RTX 4090: FPS, Average
- Diablo 2 Resurrected – 1280×720, RTX 4090: FPS, Average
- Dota 2 – 1280×720, RTX 4090: FPS, Average
- Forspoken – 1280×720, RTX 4090: FPS, Average
- Fortnite – 1280×720, RTX 4090: FPS, Average
- Ghostwire Tokyo – 1280×720, RTX 4090: FPS, Average
- Resident Evil Village – 1280×720, RTX 4090: FPS, Average
- Spider-Man – 1280×720, RTX 4090: FPS, Average
- The Callisto Protocol – 1280×720, RTX 4090: FPS, Average
- The Witcher 3 – 1280×720, RTX 4090: FPS, Average
- Uncharted – 1280×720, RTX 4090: FPS, Average
-
- AMD Ryzen 9 7950X3D 96.4
- Intel Core i9-13900KS93.3
- Intel Core i9-13900K92.8
- Intel Core i7-13700K89.6
- Intel Core i5-13600K83,3
- AMD Ryzen 9 7950X81,3
- AMD Ryzen 9 7900X80, 2
- AMD Ryzen 7 7700X80.0
- AMD Ryzen 7 5800X3D76.9
- AMD Ryzen 7 5800X61.0
Unit: Percent Edit Performance Rating, RTX 4090 – Percentile FPS Inflow Charts All None
- Age of Empires 4 – 1280×720, RTX 4090: FPS, 1% percentile
- Call of Duty Warzone 2 – 1280×720, RTX 4090: FPS, 1% percentile
- Cyberpunk 2077 + RT – 1280×720, RTX 4090: FPS, 1% percentile
- Diablo 2 Resurrected – 1,280 × 720, RTX 4090: FPS, 1% percentile
- Dota 2 – 1280×720, RTX 4090: FPS, 1% percentile
- Forspoken – 1280×720, RTX 4090: FPS, 1% percentile
- Fortnite – 1280×720, RTX 4090: FPS , 1% percentile
- Ghostwire Tokyo – 1280×720, RTX 4090: FPS, 1% percentile
- Resident Evil Village – 1280×720, RTX 4090: FPS, 1% percentile
- Spider-Man – 1280 × 720, RTX 4090: FPS, 1% percentile
- The Callisto Protocol – 1280 × 720, RTX 4090: FPS, 1% percentile
- The Witcher 3 – 1280 × 720, RTX 4090: FPS, 1% percentile
- Uncharted – 1,280 × 720, RTX 4090: FPS, 1% percentile
< li>Dead Space – 1,280 × 720, RTX 4090: FPS, 1% percentile
-
- AMD Ryzen 9 7950X3D95.8
- Intel Core i9-13900KS94.6
- Intel Core i9-13900K94.1
- Intel Core i7-13700K91.5
- Intel Core i5-13600K85.2
- AMD Ryzen 9 7950X82.5
- AMD Ryzen 9 7900X81.1
- AMD Ryzen 7 7700X79 ,9
- AMD Ryzen 7 5800X3D75,0
- AMD Ryzen 7 5800X60.8
li>
Unit: percent
Up to 42 percent more FPS through the V-Cache
As with its predecessor, the usefulness of the cache depends heavily on the game. Some titles benefit only slightly, while others show huge advantages. For example, Diablo II: Resurrected does not react at all to the 3D cache, here Ryzen 9 7950X and Ryzen 9 7950X3D are absolutely equally fast.
On the other hand, there are games like Dota 2, which delivers 42 percent more FPS on the Ryzen 9 7950X3D, allowing the CPU to outperform all competition by miles. Ghostwire: Tokyo and Resident Evil Village are also titles where the performance increase is more than 30 percent. Most of the time, the truth lies somewhere between the extremes. For example, Call of Duty Warzone 2.0 is up 21 percent, Cyberpunk 2077 is up 15 percent, and Forspoken is up 7 percent.
1,280 × 720, RTX 4090
- Age of Empires 4
- Call of Duty Warzone 2
- Cyberpunk 2077 + RT
- Dead Space
- Diablo 2 Resurrected
- Dota 2
- Forspoken
- Fortnite
- Ghostwire Tokyo
- Resident Evil Village
- Spider Man
- The Callisto Protocol
- The Witcher 3
- Uncharted
Age of Empires 4 – 1280×720, RTX 4090
- FPS, Average:
- Intel Core i9-13900KS218.8
- Intel Core i9-13900K216.4
- Intel Core i7 -13700K202.4
- AMD Ryzen 9 7950X3D200.7
- Intel Core i5-13600K193.5
- AMD Ryzen 9 7900X175.7
- AMD Ryzen 7 7700X172.0
- AMD Ryzen 9 7950X170.8
< li class="chart__row">AMD Ryzen 7 5800X3D156.4
- AMD Ryzen 7 5800X145.8
- Intel Core i9-13900KS180.6
- Intel Core i9-13900K180.6
- Intel Core i7-13700K168.4
< li class="chart__row">Intel Core i5-13600K166.2
Unit: frames per second (FPS) Call of Duty Warzone 2 – 1,280 × 720, RTX 4090
- FPS, Average:
- AMD Ryzen 9 7950X3D226.8 li>
- Intel Core i9-13900KS210.4
- Intel Core i9-13900K210.1
- Intel Core i7-13700K203.6
- AMD Ryzen 9 7900X189.7
- AMD Ryzen 9 7950X186.9
- Intel Core i5-13600K186, 2
- AMD Ryzen 7 5800X3D171.3
- AMD Ryzen 7 7700X165.1
- AMD Ryzen 7 5800X125.5
- FPS, 1% percentile:
- < strong>AMD Ryzen 9 7950X3D143.5
- Intel Core i9-13900KS143.2
- Intel Core i9-13900K142.7
- Intel Core i7-13700K139.3
< li class="chart__row">Intel Core i5-13600K132.9
- AMD Ryzen 9 7950X129.0
- AMD Ryzen 9 7900X128.7
- AMD Ryzen 7 7700X115.3
- AMD Ryzen 7 5800X3D114.4
- AMD Ryzen 7 5800X86.8
Unit: frames per second (FPS) Cyberpunk 2077 + RT – 1280×720, RTX 4090
- FPS , Average:
- AMD Ryzen 9 7950X3D117.2
- Intel Core i9 -13900KS111,2
- Intel Core i9-13900K111,2
- Intel Core i7-13700K110,1
- Intel Core i5-13600K105.8
- AMD Ryzen 9 7950X102.2
- AMD Ryzen 7 7700X100.8
- AMD Ryzen 9 7900X99.7
- AMD Ryzen 7 5800X3D92.5
- AMD Ryzen 7 5800X77.1
- FPS, 1% percentile:
- AMD Ryzen 9 7950X3D96.4
- Intel Core i7-13700K94,5
- Intel Core i9-13900KS93,9
- Intel Core i9-13900K93.8
- Intel Core i5-13600K89.3
- AMD Ryzen 9 7950X86.8
- AMD Ryzen 7 7700X84.6
- AMD Ryzen 9 7900X84.3
- AMD Ryzen 7 5800X3D76.0
- AMD Ryzen 7 5800X63.5
li>
Unit: Frames per second (FPS) Dead Space – 1,280 × 720, RTX 4090 < ul class="chart__groups toggle-body-container" id="chart-groups-133408">
- AMD Ryzen 9 7950X3D213.5
- Intel Core i9-13900KS213,3
- Intel Core i9-13900K212,6
- Intel Core i7-13700K208, 6
- Intel Core i5-13600K190.8
- AMD Ryzen 9 7950X187.0
- AMD Ryzen 9 7900X183.2
- AMD Ryzen 7 7700X169.1
- AMD Ryzen 7 5800X3D166.7
- AMD Ryzen 7 5800X130.4
- AMD Ryzen 9 7950X3D126.3
- Intel Core i7-13700K121.1
- Intel Core i9-13900KS119.1
- Intel Core i9-13900K118.7
- AMD Ryzen 9 7950X114.9
- Intel Core i5-13600K113.5
- AMD Ryzen 9 7900X112.1
- AMD Ryzen 7 7700X104.2
- AMD Ryzen 7 5800X3D99.9
- AMD Ryzen 7 5800X81.8
Unit: frames per second (FPS) Diablo 2 Resurrected – 1280×720, RTX 4090
- FPS, Average:
- Intel Core i9-13900KS565.9
- Intel Core i9-13900K553.5
- AMD Ryzen 7 7700X538 ,2
- Intel Core i7-13700K519.5
- AMD Ryzen 9 7950X3D496.1
- AMD Ryzen 9 7950X495.5
- AMD Ryzen 9 7900X493.5
- Intel Core i5-13600K470 ,0
- AMD Ryzen 7 5800X410,7
- AMD Ryzen 7 5800X3D409.5
- FPS, 1% percentile:
- Intel Core i9-13900KS462.8
- Intel Core i9-13900K453.5
- AMD Ryzen 7 7700X418.5
- Intel Core i7-13700K412.9
- AMD Ryzen 9 7950X3D386.7
- AMD Ryzen 9 7900X380.3
- AMD Ryzen 9 7950X379.0
- Intel Core i5-13600K359.4
- AMD Ryzen 7 5800X3D322.0
- AMD Ryzen 7 5800X299, 7
Unit: frames per second (FPS) Dota 2 – 1,280 × 720, RTX 4090
- FPS, Average:
- AMD Ryzen 9 7950X3D390.7
- AMD Ryzen 7 5800X3D300.6
- AMD Ryzen 9 7950X275.0
- Intel Core i9-13900KS271.9
- Intel Core i9-13900K269.1
- AMD Ryzen 9 7900X267.4
- Intel Core i7-13700K257.9< /li>
- AMD Ryzen 7 7700X244.0
- Intel Core i5-13600K234.9
- AMD Ryzen 7 5800X197.3
- FPS, 1% percentile:
- AMD Ryzen 9 7950X3D195.7
- Intel Core i9-13900KS158.8
- Intel Core i9-13900K156.9
- AMD Ryzen 7 5800X3D156.4
- Intel Core i7-13700K153.9
- Intel Core i5-13600K145.4
- AMD Ryzen 9 7950X144.7
- AMD Ryzen 9 7900X142.4
- AMD Ryzen 7 7700X132.6
- AMD Ryzen 7 5800X106.6
Unit: frames per second (FPS) Forspoken – 1280 × 720, RTX 4090
- FPS, Average:
- Intel Core i9-13900KS118.1
- Intel Core i9-13900K116.5
- Intel Core i7- 13700K112.6
- Intel Core i5-13600K103.3
- AMD Ryzen 9 7950X3D96.9
- AMD Ryzen 9 7950X90, 4
- AMD Ryzen 9 7900X88.5
- AMD Ryzen 7 7700X86.5
- AMD Ryzen 7 5800X3D73.4
- AMD Ryzen 7 5800X55.0
- FPS, 1% percentile: < ul class="chart__group-body">
- Intel Core i9-13900KS78,2
- Intel Core i9-13900K76.8
- Intel Core i7-13700K75.9
- AMD Ryzen 9 7950X3D70 ,7
- Intel Core i5-13600K68,8
- AMD Ryzen 9 7950X63,7
- AMD Ryzen 7 7700X63.5
- AMD Ryzen 9 7900X62.6
- AMD Ryzen 7 5800X3D53.3
- AMD Ryzen 7 5800X38.8
Unit: frames per second (FPS) Fortnite – 1,280 × 720, RTX 4090
- FPS, average:
- AMD Ryzen 9 7950X3D211,1
- Intel Core i7-13700K205, 2
- Intel Core i9-13900KS200.4
- Intel Core i9-13900K200.3
- Intel Core i5-13600K197.6
- AMD Ryzen 9 7900X180.6
- AMD Ryzen 9 7950X177.1
- AMD Ryzen 7 7700X173.0
- AMD Ryzen 7 5800X3D161.5
- AMD Ryzen 7 5800X140.5
- FPS, 1% percentile:
- AMD Ryzen 9 7950X3D151.7
- Intel Core i9-13900KS150,1
- Intel Core i9-13900K149,9
- Intel Core i5-13600K145.5
- Intel Core i7-13700K141.2
- AMD Ryzen 9 7900X138 ,6
- AMD Ryzen 9 7950X135.4
- AMD Ryzen 7 7700X124.4
- AMD Ryzen 7 5800X3D111.3
- AMD Ryzen 7 5800X109.5
Unit: frames per second (FPS) Ghostwire Tokyo – 1280 × 720, RTX 4090
- FPS, average :
- AMD Ryzen 9 7950X3D206.6
- Intel Core i9-13900KS196 ,0
- Intel Core i9-13900K195.6
- Intel Core i7-13700K179.9
- Intel Core i5-13600K170.9
- AMD Ryzen 7 7700X160.4
- AMD Ryzen 7 5800X3D160.4
- AMD Ryzen 9 7950X157.7
- AMD Ryzen 9 7900X155.6
- AMD Ryzen 7 5800X119.7
- FPS, 1% percentile:
- Intel Core i9-13900KS93, 7
- Intel Core i9-13900K93.4
- Intel Core i7-13700K90.6
- AMD Ryzen 9 7950X3D87.2
- Intel Core i5-13600K83,4
- AMD Ryzen 9 7950X77,7
- AMD Ryzen 7 7700X76,8
- AMD Ryzen 9 7900X75.9
- AMD Ryzen 7 5800X3D64.0
- AMD Ryzen 7 5800X57.5
Unit: frames per second (FPS) Resident Evil Village – 1,280 × 720, RTX 4090
- FPS, Average:
- AMD Ryzen 9 7950X3D485.8
- AMD Ryzen 7 5800X3D381,6
- Intel Core i9-13900KS372,4
- Intel Core i9-13900K369,6
- AMD Ryzen 7 7700X365.0
- AMD Ryzen 9 7950X354.5
- Intel Core i7-13700K345.9
- AMD Ryzen 9 7900X332.3
- Intel Core i5-13600K315.2
- AMD Ryzen 7 5800X265.7
- FPS, 1% percentile :
- AMD Ryzen 9 7950X3D358.6
- Intel Core i9-13900KS273 ,0
- AMD Ryzen 7 5800X3D272,9
- Intel Core i9-13900K272,9
- AMD Ryzen 7 7700X265.0
- AMD Ryzen 9 7950X262.1
- Intel Core i7-13700K253.5
- AMD Ryzen 9 7900X250.2
- Intel Core i5-13600K227 ,0
- AMD Ryzen 7 5800X198,9
Unit: frames per second (FPS) Spider-Man – 1,280× 720, RTX 4090
- FPS, average:
- Intel Core i9-13900KS116.1
- Intel Core i9-13900K116.0
- Intel Core i7-13700K109.5
- AMD Ryzen 9 7950X3D105.1
- Intel Core i5-13600K101.5
- AMD Ryzen 7 7700X93.5
- AMD Ryzen 9 7950X93.4
- AMD Ryzen 9 7900X89.6
- AMD Ryzen 7 5800X3D80, 0
- AMD Ryzen 7 5800X68.3
- FPS, 1% percentile:
- Intel Core i9-13900KS91.3
- Intel Core i9-13900K91.2
- Intel Core i7-13700K88.8
- Intel Core i5-13600K85.1
- AMD Ryzen 9 7950X3D80.0
- AMD Ryzen 7 7700X76.8
- AMD Ryzen 9 7950X70.6
- AMD Ryzen 9 7900X67.8
- AMD Ryzen 7 5800X3D62.7
- AMD Ryzen 7 5800X56.0
Unit: Frames per second (FPS) The Callisto Protocol – 1280 × 720, RTX 4090
- FPS, average:
- AMD Ryzen 9 7950X3D262.5
- Intel Core i9-13900KS253, 0
- Intel Core i9-13900K252.7
- Intel Core i7-13700K237.5
- Intel Core i5-13600K223.9
< li class="chart__row">AMD Ryzen 9 7900X217.4
- AMD Ryzen 7 7700X215.4
- AMD Ryzen 9 7950X214.1< /li>
- AMD Ryzen 7 5800X3D204.0
- AMD Ryzen 7 5800X167.2
- AMD Ryzen 9 7950X3D196.8
- Intel Core i9-13900KS186.3
- Intel Core i7-13700K185.0< /li>
- Intel Core i9-13900K184.4
- AMD Ryzen 9 7950X167.9
- AMD Ryzen 9 7900X166.9
- Intel Core i5-13600K159.8
- AMD Ryzen 7 7700X156.6
- AMD Ryzen 7 5800X3D149.1
- AMD Ryzen 7 5800X118.9
Unit: frames per second (FPS) The Witcher 3 – 1,280 × 720, RTX 4090
- FPS, Average:
- Intel Core i7-13700K223.0< /li>
- AMD Ryzen 9 7950X3D221.9
- Intel Core i9-13900KS215.5
- Intel Core i9-13900K215.3
- AMD Ryzen 7 5800X3D213,4
- Intel Core i5-13600K209,3
- AMD Ryzen 7 7700X205,3
- AMD Ryzen 9 7950X194.6
- AMD Ryzen 9 7900X193.7
- AMD Ryzen 7 5800X152.4
- FPS, 1% percentile:
- AMD Ryzen 9 7950X3D171.7
- Intel Core i7-13700K164.7
- Intel Core i9-13900KS162.1
- Intel Core i9-13900K162.0
- Intel Core i5- 13600K149.8
- AMD Ryzen 9 7950X147.0
- AMD Ryzen 9 7900X137.5
- AMD Ryzen 7 5800X3D133.3
- AMD Ryzen 7 7700X131.9
- AMD Ryzen 7 5800X100.2
Unit: frames per second (FPS) Uncharted – 1280 × 720, RTX 4090
- FPS, average:
- AMD Ryzen 9 7950X3D172.4
- Intel Core i9-13900KS166, 9
- Intel Core i9-13900K165.1
- Intel Core i7-13700K162.8
- AMD Ryzen 7 5800X3D157.8
- AMD Ryzen 7 7700X154.4
- AMD Ryzen 9 7950X153.1
- Intel Core i5-13600K149.4
- AMD Ryzen 9 7900X146, 9
- AMD Ryzen 7 5800X124.5
- FPS, 1% percentile:
- AMD Ryzen 9 7950X3D127.0
- Intel Core i9-13900KS117.2
- Intel Core i9-13900K115.9
- Intel Core i7-13700K113.9
- AMD Ryzen 9 7950X109.1
- AMD Ryzen 7 7700X107.3
- Intel Core i5-13600K104.7
- AMD Ryzen 7 5800X3D104.2
- AMD Ryzen 9 7900X103.4
- AMD Ryzen 7 5800X84.3
li>
Unit: frames per second (FPS)
Gaming benchmarks in 720p on the Radeon RX 7900 XTX
Not only do AMD and Nvidia graphics cards generally behave differently, processors can also react differently in individual games depending on the graphics card . And that is also the case in the new gaming course. If there is no Nvidia graphics card in the computer, but an AMD Radeon RX 7900 XTX, the results are not great, but slightly different.
Because in connection with the AMD GPU, the Ryzen 9 7950X3D can set itself apart a little further from the Core i9-13900K: Instead of 4 percent, the lead is 7 percent, which also applies to the distance to the KS. Interestingly, the distance to the Ryzen 9 7950X without 3D V-Cache shrinks minimally: instead of 19 percent more FPS, there is 17 percent more FPS in the second series of measurements. Accordingly, the X3D does not suddenly increase, but the general relationship between AMD and Intel changes. Whether Intel CPUs work too slowly with a Radeon or Ryzen processors too slowly with an Nvidia GPU is in the realm of speculation.
Performance rating, RX 7900 XTX
- AVG FPS
- Percentile FPS
Edit Performance rating, RX 7900 XTX – AVG FPS Inflow charts All None
- Age of Empires 4 – 1,280 × 720, RX 7900 XTX: FPS, Average
- Call of Duty Warzone 2 – 1280×720, RX 7900 XTX: FPS, Average
- Cyberpunk 2077 + RT – 1280×720, RX 7900 XTX: FPS, Average
- Dead Space – 1280×720, RX 7900 XTX: FPS, Average
- Diablo 2 Resurrected – 1280×720, RX 7900 XTX: FPS, Average
- Dota 2 – 1280×720, RX 7900 XTX: FPS, average
- Forspoken – 1,280 × 720, RX 7900 XTX: FPS, average
- Fortnite – 1,280 × 720, RX 7900 XTX: FPS, average
- Ghostwire Tokyo – 1280×720, RX 7900 XTX: FPS, Average
- Resident Evil Village – 1280×720, RX 7900 XTX: FPS, Average
- Spider-Man – 1280×720 , RX 7900 XTX: FPS, Average
- The Callisto Protocol – 1280×720, RX 7900 XTX: FPS, Average
- The Witcher 3 – 1280×720, RX 7900 XTX: FPS , Average
- Uncharted – 1280×720, RX 7900 XTX: FPS, Average
-
- AMD Ryzen 9 7950X3D98.0
- Intel Core i9-13900KS92.0
- Intel Core i9-13900K91.3
- Intel Core i7-13700K89.1
- Intel Core i5-13600K84.9
- AMD Ryzen 7 7700X83.9
- AMD Ryzen 9 7950X83 ,5
- AMD Ryzen 9 7900X82,9
- AMD Ryzen 7 5800X3D82,2
- AMD Ryzen 7 5800X66,6
Unit: Percent Edit Performance Rating, RX 7900 XTX – Percentile FPS Inflow charts All None
- Age of Empires 4 – 1,280×720, RX 7900 XTX: FPS, 1% percentile
- Call of Duty Warzone 2 – 1280×720, RX 7900 XTX: FPS, 1% percentile
- Cyberpunk 2077 + RT – 1280×720, RX 7900 XTX: FPS, 1% percentile
- Dead Space – 1280×720, RX 7900 XTX: FPS, 1% percentile
- Diablo 2 Resurrected – 1280×720, RX 7900 XTX: FPS, 1% percentile
- Dota 2 – 1280×720, RX 7900 XTX: FPS, 1% percentile
- Forspoken – 1280×720, RX 7900 XTX: FPS, 1% percentile
- Fortnite – 1280×720, RX 7900 XTX: FPS, 1% percentile
- Ghostwire Tokyo – 1280×720, RX 7900 XTX: FPS, 1% percentile
- Resident Evil Village – 1280×720, RX 7900 XTX: FPS , 1% percentile
- Spider-Man – 1280×720, RX 7900 XTX: FPS, 1% percentile
- The Callisto Protocol – 1280×720, RX 7900 XTX: FPS, 1% percentile
- The Witcher 3 – 1280×720, RX 7900 XTX: FPS, 1% percentile
- Uncharted – 1280 × 720, RX 7900 XTX: FPS, 1% percentile
-
- AMD Ryzen 9 7950X3D96.0
- Intel Core i9-13900KS94 ,4
- Intel Core i9-13900K94,0
- Intel Core i7-13700K91.8
- Intel Core i5-13600K86.4
- AMD Ryzen 9 7950X84 ,3
- AMD Ryzen 7 7700X83,6
- AMD Ryzen 9 7900X83,2
- AMD Ryzen 7 5800X3D79.9
- AMD Ryzen 7 5800X65.3
Unit: percent
The big differences in performance between the individual games also exist on the Radeon RX 7900 XTX. Diablo II is still the weak point of the new CPU, the Ryzen 9 7950X3D is only 1 percent faster than the Ryzen 9 7950X. Dota 2 is again the absolute highlight of the processor, the additional cache brings a whopping 44 percent more FPS. Ghostwire: Tokyo and Resident Evil Village take another giant leap. All three games benefit by at least 40 percent on the Radeon, on the GeForce the 40 mark was only broken in one game. In other games (such as Cyberpunk 2077 and Dead Space), however, the GeForce RTX 4090 can squeeze a little more performance out of the new processor.
1,280 × 720, RX 7900 XTX
- Age of Empires 4
- Call of Duty Warzone 2< /li>
- Cyberpunk 2077 + RT
- Dead Space
- Diablo 2 Resurrected
- Dota 2
- Forspoken
- Fortnite
- Ghostwire Tokyo
- Resident Evil Village
- Spider-Man
- The Callisto Protocol
- The Witcher 3
- Uncharted
Age of Empires 4 – 1280×720, RX 7900 XTX
- FPS, Average:
- Intel Core i9-13900KS236,1
- Intel Core i9-13900K233.0
- Intel Core i7-13700K219.0
- AMD Ryzen 9 7950X3D215.5
- Intel Core i5-13600K213.3
- AMD Ryzen 7 7700X189.8
- AMD Ryzen 9 7900X185.5
- AMD Ryzen 9 7950X180.5
- AMD Ryzen 7 5800X3D172, 1
- AMD Ryzen 7 5800X156.5
- FPS, 1% percentile:
- Intel Core i9-13900KS196.4
- Intel Core i9-13900K193.6
- AMD Ryzen 9 7950X3D192.4
- Intel Core i7- 13700K185.8
- Intel Core i5-13600K183.0
- AMD Ryzen 7 5800X3D151.5
- AMD Ryzen 9 7900X141.6
- AMD Ryzen 7 7700X136.0
- AMD Ryzen 9 7950X134.4
- AMD Ryzen 7 5800X115.1
Unit: frames per second (FPS) Call of Duty Warzone 2 – 1280×720, RX 7900 XTX
- FPS, Average:
- AMD Ryzen 9 7950X3D230.2
< li class="chart__row">Intel Core i9-13900KS215.8
- Intel Core i9-13900K215.7
- Intel Core i7-13700K200.2
- AMD Ryzen 9 7900X191 ,9
- Intel Core i5-13600K191,2
- AMD Ryzen 9 7950X186,8
- AMD Ryzen 7 5800X3D171.0
- AMD Ryzen 7 7700X169.9
- AMD Ryzen 7 5800X131.0
- Intel Core i9-13900KS146.4
- Intel Core i9-13900K146.2
- AMD Ryzen 9 7950X3D139.9
- Intel Core i7-13700K138.9
- AMD Ryzen 9 7950X135.0
- Intel Core i5-13600K134.0
- AMD Ryzen 9 7900X129.3
- AMD Ryzen 7 7700X120 ,0
- AMD Ryzen 7 5800X3D107,5
- AMD Ryzen 7 5800X90.6
Unit: frames per second (FPS) Cyberpunk 2077 + RT – 1,280 × 720, RX 7900 XTX
- FPS, Average:
- AMD Ryzen 9 7950X3D127.4
- Intel Core i9-13900KS122.9
- Intel Core i9 -13900K122.5
- Intel Core i7-13700K121.4
- AMD Ryzen 7 7700X116.8
- Intel Core i5-13600K116.6
- AMD Ryzen 9 7950X115.1
- AMD Ryzen 9 7900X113.4
- AMD Ryzen 7 5800X3D107.9
- AMD Ryzen 7 5800X88.8
li>
- FPS, 1% percentile:
- Intel Core i9-13900KS84.5
- Intel Core i9-13900K84.5
- AMD Ryzen 7 7700X82.1
- Intel Core i7-13700K79.9
- AMD Ryzen 9 7950X77.9
- AMD Ryzen 9 7900X76.3
- Intel Core i5-13600K70.0< /li>
- AMD Ryzen 7 5800X3D69.9
- AMD Ryzen 9 7950X3D66.1
- AMD Ryzen 7 5800X61.0
Unit: frames per second (FPS) Dead Space – 1280 × 720, RX 7900 XTX
- FPS, Average:
- AMD Ryzen 9 7950X3D145.8
- Intel Core i7- 13700K144.0
- AMD Ryzen 9 7950X143.1
- AMD Ryzen 9 7900X142.7
- AMD Ryzen 7 7700X142.2
- AMD Ryzen 7 5800X3D139,3
- Intel Core i5-13600K139,3
- Intel Core i9-13900KS128,6
- Intel Core i9-13900K128.5
- AMD Ryzen 7 5800X122.6
- FPS, 1% percentile:
- Intel Core i7-13700K95.2
- AMD Ryzen 9 7950X3D93.4
- AMD Ryzen 9 7950X91.4
- AMD Ryzen 9 7900X91.1
- AMD Ryzen 7 7700X90.2
- Intel Core i5-13600K89, 9
- Intel Core i9-13900KS87,7
- AMD Ryzen 7 5800X3D86,3
- Intel Core i9-13900K86.3
- AMD Ryzen 7 5800X71.3
Unit: Frames Per Second (FPS) Diablo 2 Resurrected – 1280×720, RX 7900 XTX
- FPS , average:
- AMD Ryzen 7 7700X410,8
- Intel Core i9-13900KS404,9
- Intel Core i9-13900K401.5
- AMD Ryzen 9 7950X3D400.7
- AMD Ryzen 9 7950X398.2
- Intel Core i7-13700K389.2
- AMD Ryzen 9 7900X387.8
- Intel Core i5-13600K356.9
- AMD Ryzen 7 5800X3D335.5
- AMD Ryzen 7 5800X327, 4
- FPS, 1% percentile:
- AMD Ryzen 7 7700X244, 2
- Intel Core i9-13900KS239.9
- Intel Core i9-13900K239.7
- AMD Ryzen 9 7950X237.5
- AMD Ryzen 9 7950X3D235.5
- Intel Core i7-13700K230.5
- AMD Ryzen 9 7900X221.6
- Intel Core i5-13600K216.5
- AMD Ryzen 7 5800X3D171.7
- AMD Ryzen 7 5800X168.8
li>
Unit: frames per second (FPS) Dota 2 – 1,280 × 720, RX 7900 XTX
- FPS, Average:
- AMD Ryzen 9 7950X3D372.0
- AMD Ryzen 7 5800X3D290,4
- Intel Core i9-13900KS268,8
- Intel Core i9-13900K265,8
- AMD Ryzen 9 7950X258.3
- Intel Core i7-13700K249.1
- AMD Ryzen 9 7900X246.8
- AMD Ryzen 7 7700X235.8
- Intel Core i5-13600K233.6
- AMD Ryzen 7 5800X191.6
- FPS, 1% percentile :
- AMD Ryzen 9 7950X3D186.7
- Intel Core i9-13900KS155 ,3
- Intel Core i9-13900K154,8
- AMD Ryzen 7 5800X3D150,1
- Intel Core i7-13700K148.4
- Intel Core i5-13600K143.3
- AMD Ryzen 9 7950X140.3
- AMD Ryzen 9 7900X134.1
- AMD Ryzen 7 7700X128.8
- AMD Ryzen 7 5800X104.5
Unit: frames per second (FPS) Forspoken – 1,280 × 720, RX 7900 XTX
- FPS, Average:
- Intel Core i9-13900KS113.7
- Intel Core i9-13900K113.7
- Intel Core i7-13700K108.2
- Intel Core i5- 13600K100.3
- AMD Ryzen 9 7950X3D97.7
- AMD Ryzen 9 7950X88.4
- AMD Ryzen 9 7900X86.0
- AMD Ryzen 7 7700X83.1
- AMD Ryzen 7 5800X3D74, 0
- AMD Ryzen 7 5800X58.6
- FPS, 1% percentile:
- Intel Core i9-13900KS70.3
- Intel Core i9-13900K70.3
- AMD Ryzen 9 7950X3D68.1
- Intel Core i7- 13700K65.0
- Intel Core i5-13600K62.3
- AMD Ryzen 9 7950X57.9
- AMD Ryzen 9 7900X56.2
- AMD Ryzen 7 7700X52.8
- AMD Ryzen 7 5800X3D52.7
- AMD Ryzen 7 5800X41.3
Unit: Frames per second (FPS) Fortnite – 1,280 × 720, RX 7900 XTX
- FPS, average: < ul class="chart__group-body">
- AMD Ryzen 9 7950X3D177.6
- Intel Core i9-13900KS168.8
- Intel Core i9-13900K165.2
- Intel Core i7-13700K164.0
- AMD Ryzen 7 5800X3D160.1
- AMD Ryzen 9 7900X159.2
- AMD Ryzen 7 7700X158.2
- AMD Ryzen 9 7950X156.5
- AMD Ryzen 7 5800X155.6
- Intel Core i5-13600K153.3
li>
- AMD Ryzen 9 7950X3D138.9
- Intel Core i7-13700K136.6
- Intel Core i9-13900KS132.4< /li>
- Intel Core i9-13900K132.3
- Intel Core i5-13600K129.2
- AMD Ryzen 9 7900X124.6
- AMD Ryzen 7 5800X3D124.2
- AMD Ryzen 7 7700X121.2
- AMD Ryzen 9 7950X120.4
- AMD Ryzen 7 5800X119.5
Unit: frames per second (FPS) Ghostwire Tokyo – 1280×720, RX 7900 XTX
- FPS, Average:
- AMD Ryzen 9 7950X3D218.3
- Intel Core i9-13900KS191.7
- Intel Core i9-13900K191.6
- Intel Core i7- 13700K184.0
- Intel Core i5-13600K176.5
- AMD Ryzen 7 5800X3D165.3
- AMD Ryzen 9 7900X160.1
- AMD Ryzen 7 7700X157.6
- AMD Ryzen 9 7950X156.6
- AMD Ryzen 7 5800X110.6
- FPS, 1% percentile:
- Intel Core i9-13900KS94.0
- Intel Core i9-13900K94.0
- AMD Ryzen 9 7950X3D89.4
- Intel Core i7-13700K87.7
- Intel Core i5-13600K83.2
- AMD Ryzen 9 7900X77.3
- AMD Ryzen 9 7950X77.2
- AMD Ryzen 7 7700X75.7
- AMD Ryzen 7 5800X3D67.5
- AMD Ryzen 7 5800X53.2
Unit: frames per second (FPS) Resident Evil Village – 1280×720, RX 7900 XTX
- FPS , Average:
- AMD Ryzen 9 7950X3D484.5
- AMD Ryzen 7 5800X3D382.8
- Intel Core i9-13900KS366.4
- Intel Core i9-13900K363.0
- AMD Ryzen 7 7700X354.4
- Intel Core i7-13700K342.0
- AMD Ryzen 9 7950X341.5
- AMD Ryzen 9 7900X334.2
- Intel Core i5-13600K318, 7
- AMD Ryzen 7 5800X285.1
- FPS, 1% percentile:
- AMD Ryzen 9 7950X3D359.8
- AMD Ryzen 7 5800X3D280.0
< li class="chart__row">Intel Core i9-13900KS270,1
- Intel Core i9-13900K270.0
- AMD Ryzen 7 7700X255.1
- Intel Core i7-13700K253.6
- AMD Ryzen 9 7950X250.5
- AMD Ryzen 9 7900X247.7
- Intel Core i5-13600K230.1< /li>
- AMD Ryzen 7 5800X205.0
Unit: frames per second (FPS) Spider-Man – 1,280×720, RX 7900 XTX
- FPS, average:
- AMD Ryzen 9 7950X3D98.1
- Intel Core i9-13900KS92.6
- Intel Core i9-13900K91.1
- AMD Ryzen 7 7700X90.4
- AMD Ryzen 9 7950X90.1
- AMD Ryzen 9 7900X88.1
- Intel Core i7-13700K86.3
- Intel Core i5-13600K85.2
- AMD Ryzen 7 5800X3D84.2
- AMD Ryzen 7 5800X70.3
- FPS, 1% percentile:
- AMD Ryzen 9 7950X3D76.1
- AMD Ryzen 7 7700X71,6
- Intel Core i9-13900KS71,2
- Intel Core i9-13900K70,2
- AMD Ryzen 9 7900X68.6
- Intel Core i5-13600K68.4
- Intel Core i7-13700K68.0
- AMD Ryzen 9 7950X67.9
- AMD Ryzen 7 5800X3D64.4
- AMD Ryzen 7 5800X56.0
Unit: Images per Second (FPS) The Callisto Protocol – 1280 × 720, RX 7900 XTX
- FPS, average: < ul class="chart__group-body">
- AMD Ryzen 9 7950X3D289.2
- Intel Core i9-13900KS270.1
- Intel Core i9-13900K266 ,9
- Intel Core i7-13700K262,4
- Intel Core i5-13600K249,2
- AMD Ryzen 7 7700X247.8
- AMD Ryzen 9 7950X243.1
- AMD Ryzen 9 7900X240.4
- AMD Ryzen 7 5800X3D233,1
- AMD Ryzen 7 5800X187.7
- AMD Ryzen 9 7950X3D207.8
- Intel Core i9-13900KS197.8
- Intel Core i9-13900K197 ,2
- Intel Core i7-13700K187.9
- AMD Ryzen 9 7900X177.0
- AMD Ryzen 7 7700X172.8
- AMD Ryzen 9 7950X171.7
- Intel Core i5-13600K169.4
- AMD Ryzen 7 5800X3D164.0
- AMD Ryzen 7 5800X125, 9
Unit: frames per second (FPS) The Witcher 3 – 1,280 × 720, RX 7900 XTX
- FPS, Average:
- Intel Core i7-13700K221,1
< li class="chart__row">AMD Ryzen 7 7700X220.7
- AMD Ryzen 9 7950X3D220.0
- AMD Ryzen 7 5800X3D217.4
- Intel Core i9-13900KS217.2
- Intel Core i9-13900K217.0
- Intel Core i5-13600K211.1
- AMD Ryzen 9 7950X194.4
- AMD Ryzen 9 7900X192.2
- AMD Ryzen 7 5800X166, 6
- Intel Core i7-13700K178.3
- Intel Core i9-13900KS167.0
- Intel Core i9-13900K166.9
- AMD Ryzen 9 7950X3D161.1
< li class="chart__row">Intel Core i5-13600K159.2
Unit: frames per second (FPS) Uncharted – 1280 × 720, RX 7900 XTX
- FPS, Average:
- Intel Core i9-13900KS196.1
- Intel Core i7-13700K194.8
- Intel Core i9 -13900K194.5
- AMD Ryzen 9 7950X3D193.8
- Intel Core i5-13600K190.7
- AMD Ryzen 7 5800X3D188.5
- AMD Ryzen 7 7700X184.0
- AMD Ryzen 9 7950X181.2
- AMD Ryzen 9 7900X177 ,0
- AMD Ryzen 7 5800X153,3
li>
- FPS, 1% percentile:
- Intel Core i9-13900KS141.5
- Intel Core i9-13900K140.9
- Intel Core i7-13700K139.4
- AMD Ryzen 9 7950X3D139.1
- Intel Core i5-13600K131.2
- AMD Ryzen 7 7700X129.7
- AMD Ryzen 9 7950X127.9
- AMD Ryzen 7 5800X3D124.6
- AMD Ryzen 9 7900X122, 8
- AMD Ryzen 7 5800X103.8
Unit: Frames per second (FPS)
Scheduling: In the test all games ran on the 3D-V-Cache-Die
The Ryzen 9 7950X3D is the first processor to use 3D V-Cache on just a single CPU chiplet when there are two of them. Even if there was a great deal of uncertainty on the Internet as to whether it would always be possible to use the correct chiplet with the cache for games, the all-clear can now be given.
So all 14 games are on the chiplet with the 3D V-Cache right from the start without any action. Not a single title ran on the chiplet with the higher clock but without the additional 64MB of cache. But was the 3D V-Cache-Die always the right choice? The editors took a closer look at AMD's CCD allocation in the analysis section.
The direct comparison of the FPS increases in the individual games Play
The power consumption in games (RTX 4090)
The Ryzen 7 5800X3D was not only able to convince with a clearly better gaming performance compared to the normal Ryzen 7 5800X, but also with a surprisingly low power consumption. And the Ryzen 9 7950X3D also succeeds in doing this, clearly even. This is again due to the fact that less data has to be sent back and forth due to the additional cache. The lower clock is also helpful.
In all 14 games, the package power of the Ryzen 9 7950X3D is an average of 72 watts (precisely predicted by the ComputerBase reader Taxxor), the maximum value was an average of 78 watts. In individual cases, the package power can increase to an average of up to 85 watts in Forspoken when playing, the maximum in the title is then 89 watts. However, the processor never reached the 100 watt mark.
The normal, much slower Ryzen 9 7950X, on the other hand, has 105 or 111 watts. The Ryzen 9 7950X3D achieves 19 percent more FPS with 31 percent less power consumption. The energy efficiency has increased significantly due to the 3D V-Cache. Interestingly, even the Ryzen 7 5800X3D with 76 watts requires 4 watts more than the new flagship, although it is an 8-core instead of 16-core processor – it was, however, still manufactured in 7 instead of 5 nm.
Package Power (AVG/Max) Ryzen 9 7950X
Package Power (AVG/Max) Ryzen 7 5800X3D
Package Power (AVG/Max) Core i9-13900K
Package Power (AVG/Max) Core i9-13900KS
Package power (AVG/Max) Age of Empires IV 53/71 watts 68/72 watts 49/50 watts 70/73 watts 72/75 watts CoD Warzone 2.0 78/83 watts 112/115 watts 82/85 watts 153/158 Watts 158/166 Watts Cyberpunk 2077 75/83 Watts 108/115 Watts 77/82 Watts 165/174 Watts 171/181 Watts Dead Space 81/85 Watts 117/125 Watts 92/97 Watts 163/180 Watts 177/191 Watts Diablo II : Resurrected 63/66 watts 91/95 watts 65/70 watts 106/112 watts 107/113 watts Dota 2 72/76 watts 101/106 watts 75/79 watts 129/140 watts 133/145 watts Forspoken 85/89 watts 123 /130 watts 84/87 watts 181/186 watts 191/196 watts Fortnite 73/84 watts 116/120 watts 75/81 watts 152/157 watts 161/164 watts Ghostwire: Tokyo 69/73 watts 111/121 watts 76/81 Watts 148/156 Watts 155/163 Watts Resident Evil Village 74/76 Watts 95/101 Watts 77/80 Watts 120/127 Watts 123/131 Watts Spider-Man Remastered 82/86 Watts 127/130 Watts 82/85 Watts 182/187 watts 194/200 watts The Callisto Protocol 66/74 watts 91/94 watts 69/73 watts 114/128 watts 119/131 watts The Witcher 3 71/75 watts 110/126 watts 79/81 watts 143/149 watts 15 6/172 watts Uncharted 69/71 watts 106/110 watts 84/88 watts 145/150 watts 147/152 watts Average 72/78 watts 105/111 watts 76/80 watts 141/148 watts 147/156 watts
Intel's fast Raptor Lake processors are completely defeated in this discipline, which did not look good compared to the normal Ryzen 9 7950X. Compared to the Ryzen 9 7950X3D, the difference is gigantic: 72 watts of average package power for the AMD CPU compared to 141 watts for the Core i9-13900K and 147 watts for the Core i9-13900KS. Accordingly, the Ryzen 9 7950X3D delivers more than twice as many FPS per watt as Intel's flagship Core i9-13900KS. Also compared to the Core i9-13900K, the efficiency is twice as high.
The clock speeds in games (RTX 4090)
As expected and already discussed above, the Ryzen 9 7950X3D clocks quite a bit lower than the Ryzen 9 7950X in games that all ran on the 3D V-Cache in the test. The latter runs at an average of 5,429 MHz in the 14 games, while the new flagship runs at a lower 5,088 MHz. That's 341 MHz or 6 percent less clock speed, which the 3D cache has to compensate for in order to even be on par. So the performance benefit from the 3D V-Cache is actually greater than the measured 19 percent.
5,275 MHz is the highest clock that could be measured on the Ryzen 9 7950X3D during the gaming benchmarks. This is probably the highest clock that the cache CCD can clock up, while the CCD without the cache can still handle it. A series of tests on the next page will show how high the processor can clock when games are not running on the cache CCD. This also shows that a maximum of 5,300 MHz should be aimed at to check whether the game was actually running on the correct CCD. On the cache CCD it can also happen that the clock rate slips below the 5.0 GHz mark. 4,833 MHz is the lowest average clock that the editors measured during testing.
AVG/Max Ryzen 9 7950X
AVG/Max Ryzen 7 5800X3D
AVG/Max Core i9-13900K
AVG/Max Core i9-13900KS
AVG/Max Age of Empires IV 5190/5250MHz 5500/5500MHz 4450/4450MHz 5500/5500MHz 5600/5600MHz CoD Warzone 2.0 5179/5225MHz 5418/5450MHz 4389/4425MHz 5500/5500MHz 5500/5500MHz Cyberpunk 2077 5.077/5.225 MHz 5.409/5.450 MHz 4.430/450 MHz 5.500/5,600 MHz DEAD Space 4.833/5.100 MHz 5.282/4.425 MHz 5.600/5.600/5.600/5.600/5.600/5.1 5.275 MHz 5.462/5,500 MHz 4.448/450 MHz 5.500/5,500 MHz 5.600/5.600 MHz DOTA 2 5.055/5,200 MHz 5.461/5,500 MHz 5.500/5.500 MHz 5.187/5.402/5.402/5.402/5.402/5.402 /4.450 MHz 5.500/5,500 MHz 5.600/5,600 MHz Fortnite 5.106/5.225 MHz 5.423/5.446/4.450 MHz 5.600/5.600 MHz GHOSTWire: Tokyo 5.449/5.441/4 MHz 5600/5600MHz Resident Evil Village 5105/5200MHz 5463/5475MHz 4449/4450MHz 5500/5500MHz 5600/5600MHz Spider-Man Remastered 5165/5225MHz 5398/5.425 MHz 4.411/450 MHz 5.500/5,500 MHz 5.600/5,600 MHz the Callisto Protocol 5.086/5.175 MHz 5.487/5,500 MHz 4,450/5,500 MHz 5.600/5,600 MHz the Witcher 4. 5.43/5450 MHz 4450MHz 5500/5500MHz 5600/5600MHz Uncharted 4952/5150MHz 5420/5450MHz 4392/4450MHz 5500/5500MHz 5600/5600MHz Average 5088/5209MHz 5.429/5.454MHz 4.423/4.446MHz 5,500/5,500 MHz 5,600/5,600 MHz
The clock loss has stayed the same to 5800X3D
Before the launch of the new cache CPUs, there was hope that the new offshoots would lose less clock speed than the normal variants compared to the Ryzen 7 5800X. But this is not the case. The Ryzen 7 5800X lost 303 MHz in the test back then (4,753 MHz to 4,450 MHz), which, like the Ryzen 9 7950X3D, is 7 percent. There have obviously been no improvements here.
But the direct comparison with the Intel offshoots is still interesting. The Core i9-13900K and Core i9-13900KS clock significantly faster in games than AMD's latest development, 5.5 and 5.6 GHz respectively. That's 8 or 10 percent more clocks than AMD, but that automatically means that Zen 4 3D offers double-digit percentages more performance per clock in games than Intel's Raptor Lake.
(*) Links marked with an asterisk are affiliate links. In the case of an order via such a link, ComputerBase participates in the sales revenue without the price increasing for the customer.
Page 1/3 Next page
CCD scheduling and RAM OC analyzes MWC 2023 (February 27 – March 2, 2023): ComputerBase is on site!