
With the Core i9-13900KS, Intel also positions a special edition CPU in the 13th Gen Core above the K model of the Core i9. For the first time, a 6.0 GHz single-core turbo is available ex works for a surcharge of more than 150 euros. In the end, the processor does not offer much more than this psychological milestone compared to the K model in the test.
Table of contents
- The Intel Core i9-13900KS in detail
- The first 6.0 GHz CPU for the mass market
- The new 320 watt mode
- KS vs. K: clock rates in theory and practice
- The 13900K has “slacked off”
- Test results
- Performance in applications (single -Core)
- Performance in applications (multi-core)
- Performance in games (720p)
- Power consumption
- Temperature
- Conclusion
The Intel Core i9-13900KS in detail
Once again, Intel has introduced the K model of the Core i9 followed by a KS model with a slight time lag. The Core i9-13900KS is only the third model in this series. The first KS was the Core i9-9900KS (test) at the end of 2019, the second as the Core i9-12900KS (test) a year ago.
The first 6.0 GHz CPU for the mass market
As usual from the predecessors, there is no difference in the chip, but in its clock speeds. With its maximum turbo clock, the Core i9-13900KS even clears a new hurdle: The Core i9-13900KS is the first (x86) CPU for the mass market that clocks at up to 6.0 GHz ex works.

CPU manufacturers have been struggling with this mark for a long time. Under halfway “normal” conditions, the first Intel processor only reached the 5 GHz mark in mid-2018, at the time also as a limited special edition in the form of the Intel Core i7-8086K (test). The Core i9-9900K(S) also offered this clock a year later. AMD had already reached this milestone in 2013, but for the AMD FX-9590 (test) it was nothing more than a Pyrrhic victory.
And now the Core i9- 13900KS 6.0 GHz – 200 MHz or 3.4 percent more than the Core i9-13900K.
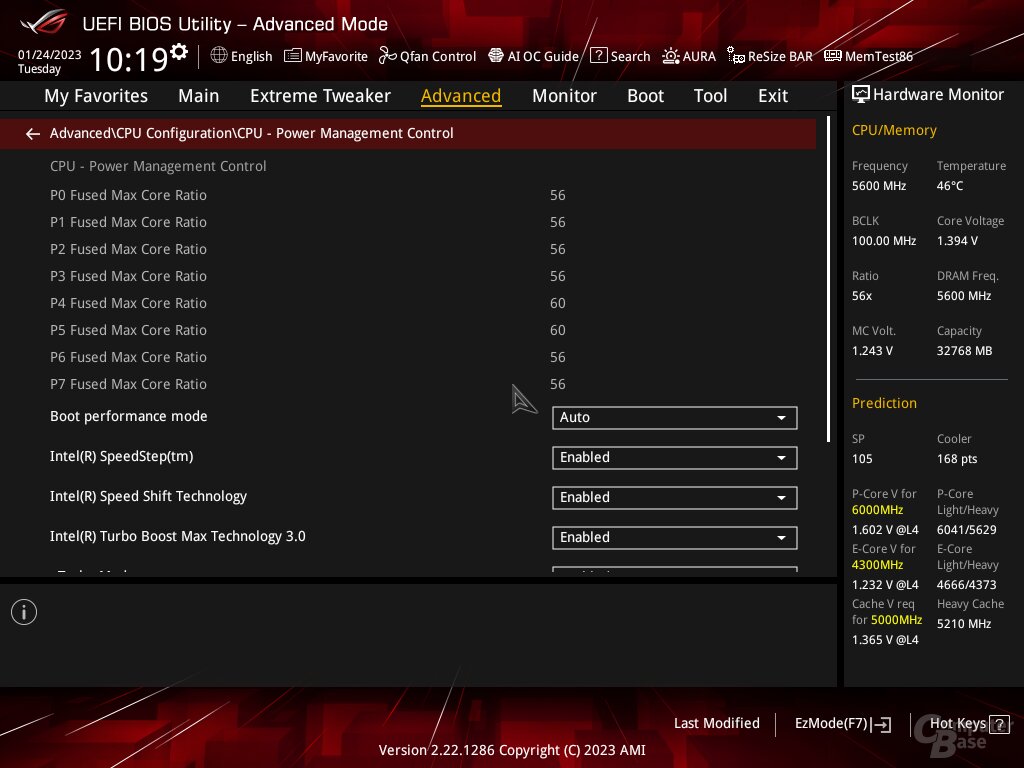
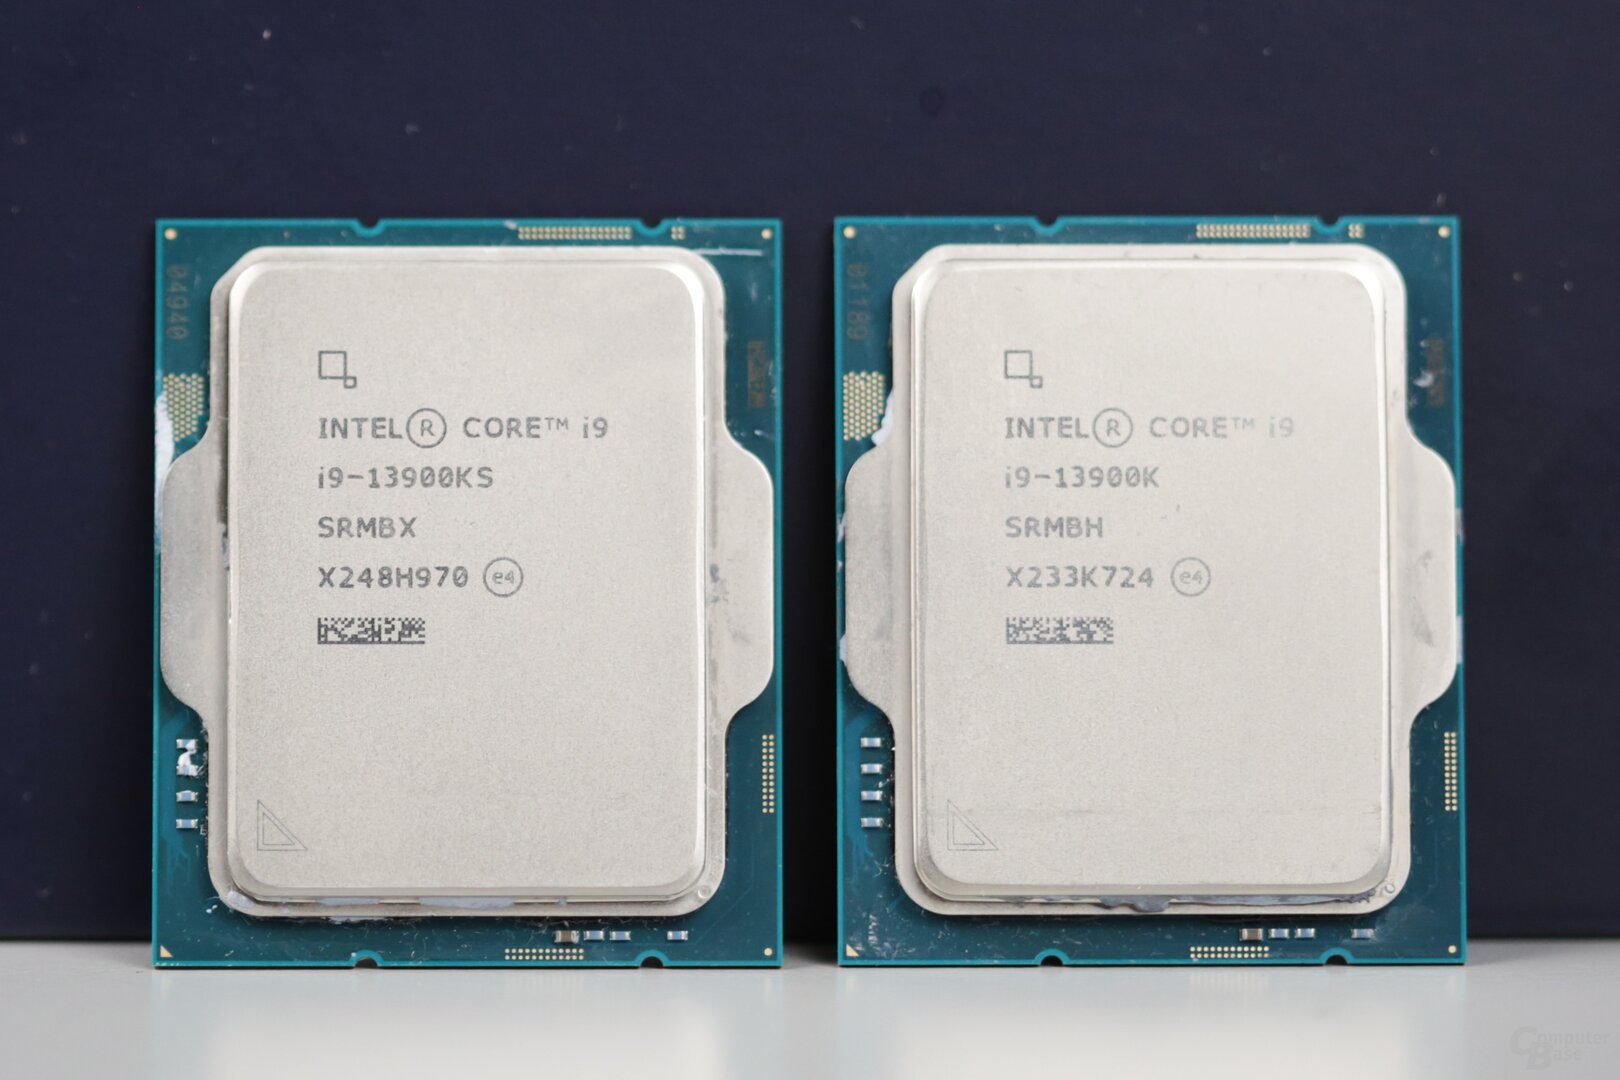
But watch out: The highest clock rate advertised by the manufacturer is only at low load, i. H. on a maximum of two cores. Intel has firmly defined which of these come into question in the CPU or its firmware. For example, the test sample only has 6.0 GHz on the performance cores 5 and 6. The rest runs with a maximum clock of 5.6 GHz, with the Core i9-13900K it is 5.8 GHz on the fastest and 5.5 GHz on the remaining cores.

The new 320 watt mode
This is interesting, because Intel itself speaks of a maximum of 5.4 GHz multi-core turbo for both CPUs in its own Intel Ark database. But in this case, the manufacturer refers to the clock in compliance with the specifications (PL1 = TDP = PL2 = 253 watts). If they are overridden, the KS can, on the other hand, clock 100 MHz higher than the K model (said 5.6 to 5.5 GHz) with higher consumption even under full multi-core load. On paper, that's 1.8 percent – and that's not much.
Up until now, “overridden” or “open” operation meant that PL2 was boosted to infinity (usually 4,096 watts) either manually or via the “Auto” setting of conventional retail mainboards. But with the KS, “Auto” means “only” 320 watts – Intel calls this mode “Extreme Power Delivery Profile”. Of course, even higher limit values can still be defined.
+ manual Core i9-13900K 253 watts manual Core i7-13700K 253 Watts Core i5-13600K 181 watts 12th Gen K models Core i9-12900KS 241 watts officially unlimited manual Core i9-12900K 241 watts Core i7-12700K 190 watts Core i5-12600K 150 watts Core i5-12400(F) 65 Watts 117 watts 28 seconds
However, the 320 watt mode (like the previously completely open operation) is not without it and explains in the reviewer's guide: Even the group was not able to keep the CPU running with a good 360 AiO water cooling system under control (i.e. cool enough with 320 watt package power). In “most cases”, however, it would have worked, the manufacturer explains diplomatically.
Even the best AIO cooler may not be able to allow the CPU to maintain 320W indefinitely without thermal throttling. Intel used a 360mm AIO cooler for our testing which was able to keep our system running without thermally throttling in most cases.
The new official mode above the official one maximum TDP (PL2) of 253 watts is reminiscent of the introduction of “Adaptive Boost” with the Intel Core i9-11900K “Rocket Lake”, which offered 5 percent more performance for 50 percent more consumption.
KS vs. K: clock rates in theory and practice
But how exactly does the Core i9-13900KS clock in practice compared to the 13900K? Putting it to the test shows that the KS can use 6.0 GHz in single-core loads (here Cinebench R23), while the K reaches a maximum of 5.8 GHz. The CPUs do not keep the clock constant, but because both act in a similar way, an average of 200 MHz more clock ultimately leads to 3 percent more single-core performance – exactly the result to be expected.
Single-core turbo -clock (CB R23 SC) 01.4002.8004.2005.6007.000MHz 15101520253035404550556065707580859095100105110115120 381425″> Core i9-13900KS, P-Cores
Under Multi- Core full load looks different. Intel itself speaks of a 5.4 GHz all-core turbo in compliance with the official maximum power loss of 253 watts. However, a glance at the BIOS has already revealed: The KS can clock up to 5.6 GHz, the K up to 5.5 GHz if consumption or alternatively the temperature does not slow it down.
With AV1 encoding in Handbrake with air cooler (Noctua NH-D15), this difference is also evident at the beginning: The KS starts with 5.6 GHz on all cores, the K with 5.5 GHz – in this case both CPUs were allowed act “openly”. After just a few seconds, however, the clocks of both CPUs drop slightly, because even with a large air cooler, both processors get too warm and have to keep lowering the clocks slightly in order not to break the 100 °C mark.
< p class="p text-width">Effectively, the KS on the P-Cores (dark blue) achieves an average clock advantage of 64 MHz (5,430 MHz to 5,366 MHz) over the P-Cores of the K (dark orange) when running on the same platform with the same BIOS as of January 2023.
The 13900K has “decreased”
This is surprising in view of the following benchmarks, in which 13900KS and 13900K in the multi-core course, even when unleashed, are equally fast on average operate, while 66 MHz would mean a one percentage point advantage for the KS.
The solution to the puzzle is revealed by looking at the Core i9-13900K log files from the October test, which match the benchmark results. Because with the BIOS available at the time for the Asus Z790 Maximus Hero, the clock of the Core i9-13900K was 59 MHz higher in the same benchmark and thus only 7 MHz below the level of the KS model today.
Multi-core turbo -Clock (Handbrake) 01.0002.0003.0004.0005.0006.000MHz 150100150200250300seconds “> Core i9-13900KS, P-Cores
The consumption of the CPU was also a bit higher then, as the following course of the package power shows.
Package Power (Handbrake) -1000100200300400Watt (W) 150100150200250300
- Core i9-13900KS
- Core i9-13900KS, AiO
- Core i9-13900K
- Core i9-13900K 10/22
When running the 13900KS with a 360mm AiO, it can hold an average of 5,558MHz – still not the maximum allowed 5,600MHz, but 128MHz more than with the air cooler. However, the difference only becomes apparent after about 20 to 30 seconds, which is why not all subsequent benchmarks benefit from it. Furthermore, the CPU sometimes has to slow down the clock drastically in order not to exceed the 100 degree Celsius mark with the now higher consumption.
Like looking at the concluding summary The table reveals that the surcharge from K to KS is significantly lower overall than in the two previous generations.
Test results< /h2>
The following application benchmarks of the Core i9-13900K are still based on the status of October 2022, the gaming benchmarks were again determined in January 2023 based on the same BIOS for all Intel Core CPUs of the 12th and 13th generation. The KS was tested in the applications with 253 watts (PL2, Noctua NH-D15), completely open (4,096 watts., with 360 mm AiO) and throttled to 142 watts (Noctua NH-D15).
UV benchmarks were also planned. Because the sample, in contrast to that of the Core i9-12900KS a year ago, did not want to run stably with either -0.125 volts or -0.100 volts VCore, it was left out in the end.
Performance in applications (single-core)
The Intel Core i9-13900KS shows a 6 GHz clock in single-core applications and increases as a result here to the old new king. On average, this means around 3 percent more performance than an Intel Core i9-13900K.
142 entries Edit Single-Core – Performance Rating Inflow charts All None
- Single-Core – Cinebench R15
- Single-Core – Cinebench R20
- Single-Core – POV-Ray
-
- Core i9-13900KS (253 W)
DDR5-5600CL38100 - Core i9-13900KS (open)
DDR5-5600CL38100 - Core i9-13900KS (open, AiO)
DDR5-5600CL3899 - Core i9-13900KS (142 W)
DDR5 -5600CL3899 - Core i9-13900K (253W)
DDR5-5600CL3897 - Core i9-13900K (65 W)
DDR5-5600CL3897 - Core i9-13900K (142W)
DDR5-5600CL3897 - Core i9-13900K (open)
DDR5-5600CL3897 - Core i9-13900K (45W)
DDR5-5600CL3897 - Core i9-13900K (88W)
DDR5-5600CL3897 - Core i9-13900K (125 W)
DDR5-5600CL3897 - Core i7-13700K (253 W)
DDR5-5600CL3890 - Ryzen 9 7950X (65W)
DDR5-5200CL3290 - Ryzen 9 7950X (142W, Eco)
DDR5 -5200CL3290 - Ryzen 9 7950X (230W)
DDR5-5200CL3290 - Core i7-13700K (88 W)
DDR5-5600CL3890 - Core i9-12900KS (open, UV)
DDR5-4400CL26, -0.125 Volt90 - Ryzen 9 7950X (88W)
DDR5-5200CL3290 - Core i7-13700K (45W)
DDR5-5600CL3890 - Ryzen 9 7900X (142 W, Eco)
DDR5-5200CL3290 - Core i7-13700K (65 W)
DDR5-5600CL3890 - Core i7-13700K (142W)
DDR5-5600CL3890 - Ryzen 9 7900X (230W)
DDR5-5200CL3290 - Ryzen 9 7900X (88W)
DDR5-5200CL3290 - Core i9-12900KS (241W)
DDR5 -4400CL2690 - Core i7-13700K (125W)
DDR5-5600CL3890 - Ryzen 9 7900X (65W)
DDR5-5200CL3289 - Ryzen 9 7900X (45W)
DDR5-5200CL3289 - Ryzen 9 7950X (45W)
DDR5-5200CL3289 - Ryzen 7 7700X (88W, Eco)
DDR5-5200CL3289 - Ryzen 7 7700X (142W)
DDR5-5200CL3288 - Ryzen 7 7700X (65W)
DDR5-5200CL3288 - Ryzen 7 7700X (45W)
DDR5-5200CL3288 - Ryzen 5 7600X (45W)
DDR5-5200CL3287 - Ryzen 9 7900 (88W)
DDR5-5200CL3287 - Ryzen 5 7600X (88W, Eco)
DDR5- 5200CL3287 - Ryzen 5 7600X (65W)
DDR5-5200CL3286 - Ryzen 5 7600X (142W)
DDR5-5200CL3286 - Core i9-12900K without E-Cores
DDR4-3200CL1486 - Core i5-13600K (181 W)
DDR5 -5600CL3686 - Core i9-12900K (125/241 W)
DDR4-3200CL1485 - Core i9-12900K
DDR4-3200CL1485 - Core i9-12900K (241W)
DDR4-3200CL1485 - Core i9-12900K (241W)
DDR5-4400CL2685 - Core i9-12900
DDR5-4400CL2684
li>
< li class="chart__row">Ryzen 7 7700 (88W)
DDR5-5200CL3283 - Core i9-13900KS (253 W)
- Core i9-12900 (65 /202W)
DDR5-4400CL2683 - Ryzen 5 7600 (65W)
DDR5-5200CL3282 - Ryzen 5 7600 (88W)
DDR5-5200CL3282 - Core i7-12700K (125/190W)
DDR4-3200CL1482 - Ryzen 5 7600 (45W)
DDR5-5200CL3282 - Core i7-12700K (190W)
DDR4-3200CL1482 - Core i7-12700K
DDR5- 4800CL3281 - Core i5-12600K (125/150 W)
DDR4-3200CL1481 - Core i5 -12600K
DDR4-3200CL1481 - Core i5-12600K (150W)
DDR4-3200CL1481 - Core i9-12900HK (65/135 W)
MSI Raider GE7677 - Core i7-12700H (45W)
XMG Neo 1576 - Core i7-12700H (120W)
XMG Neo 1576 - Core i5-13400F (65 W)
DDR5-5600CL3276 - Core i5-12500 (65/117 W)
DDR4-3200CL1476 - Core i7-12700H (35/60 W)
XMG Neo 1576 - Core i5-12500
DDR4-3200CL1476 - Core i5-13400F
DDR5-5600CL3276 - Core i7-12700H (120W) AiO
XMG Neo 1575 - Ryzen 9 5950X
DDR4-3200CL1474 - Core i9-11900K (125/250 W)
DDR4-3200CL1474 - Ryzen 9 5900X
DDR4-3200CL1473 - Core i5-12400
DDR4-3200CL1472 - Core i5-12400 (65/117 W)
DDR4-3200CL1472 - Ryzen 7 5800X
DDR4-3200CL1472 - Core i3-12100F ( 58/89 W)
DDR4-3200CL1471 - Core i9-11900KB (65/109 W)
DDR4- 3200CL1470 - Ryzen 9 6900HS (35W)
Asus ROG Zephyrus G1470 - Ryzen 7 5700X
DDR4-3200CL1469 - Ryzen 5 5600X
DDR4-3200CL1469 - Core i7-11700K
DDR4- 2933CL1469 - Ryzen 9 6900HS (45 Watt)
Asus ROG Zephyrus G1469 - Core i7-11700K (125/250 W)
DDR4-2933CL1469 - Core i9-11980HK (95/200W)
DDR4-3200CL1469 - Ryzen 9 5980HS (80W)
Asus ROG Flow X1368 - Core i5-11600K
DDR4-3200CL1468 - Ryzen 7 5700G
DDR4-3200CL1468 - Core i5-11600K (125/250 LT)
DDR4-3200CL1468 - Core i9-11980HK (30/200W)
DDR4-3200CL1468 - Ryzen 7 5800X3D
DDR4-3200CL1467 - Core i7-11700 (65/224 W)
DDR4-2933CL1467 - Core i7-11700 (2933G1)
DDR4-2933CL1467 - Core i7-11800H (120 W)
XMG Neo 1564 - Ryzen 7 5800H (80W)
XMG Core 1564 - Core i7-11800H (35/60 W)
XMG Neo 1564 - Core i7-11800H (45W)
XMG Neo 1564 - Ryzen 5 5600G
DDR4-3200CL1464 - Core i9-10900K (125/250 W)
DDR4-2933CL1463 - Core i9-10900K
DDR4-2933CL1463 - Core i9-10850K
DDR4-2933CL1463 - Core i7-10700K
DDR4-2666CL1462 - Core i5-11400F
DDR4-2933CL1461 - Ryzen 5 5500
DDR4-3200CL1461 - Core i5-11400F (65/154 W)
DDR4-2933CL1461 - Core i9-9900KS
DDR4-2666CL1461 - Core i9-9900KS (127/159 W)
DDR4-2666CL1460 - Core i9-9900K
DDR4-2666CL1460 - Ryzen 7 3800XT
DDR4-3200CL1460 - Ryzen 9 3900XT
DDR4-3200CL1460 - Ryzen 9 3950X
DDR4-3200CL1460 - Core i9-9980HK (65/95 W)
Intel Whitebook59 - Ryzen 5 3600XT
DDR4-3200CL1459 - Core i5-10600K (125/182 W)
DDR4-2933CL1458 - Core i5-10600K
DDR4-2933CL1458< /li> - Core i7-10875H (45W)
Aero 15 OLED58 - Ryzen 9 3900X
DDR4-3200CL1458 - Core i7-10875H (62 W)< br>Aero 15 OLED58
- Ryzen Threadripper 3970X
DDR4-3200CL1458 - Ryzen Threadripper 3960X
DDR4-3200CL1457 - Ryzen 7 3800X
DDR4-3200CL1457 - Core i9-10980XE
DDR4-2933CL1457 - Core i7-8700K
DDR4-2666CL1456 - Core i7-10700 (65/225 W)
DDR4-2666CL1456 - Ryzen 7 3700X
DDR4-3200CL1456 - Ryzen 3 3300X
DDR4-3200CL1456 - Ryzen 7 4750G Pro
DDR4-3200CL1456 - Ryzen 5 3600X
DDR4-3200CL1456 - Core i7-9700 (65/81W)
DDR4-2666CL1456 - Core i7-9700
DDR4-2666CL1456 - Ryzen Threadripper 3990X
DDR4-3200CL1455 - Ryzen 9 4900HS (35W)
Asus ROG Strix G1455 - Ryzen 9 4900HS55
- Core i7-10710U
Intel NUC55 - Ryzen 5 4650G Pro
DDR4-3200CL1455 - Core i9-9980XE
DDR4-2400CL1454 - Ryzen 5 3600
DDR4-3200CL1454 - Core i9-9900X
DDR4-2400CL1454 - Core i7-9800X
DDR4-2400CL1453 - Core i9-7900X
DDR4-2400CL1453 - Core i7-7700K
DDR4-2400CL1453 - Core i9-7980XE
DDR4-2400CL1453 - Ryzen 3 4350G Pro
DDR4-3200CL1452 - Core i5-10400F
DDR4-2666CL1452 - Core i9-7960X
DDR4-2400CL1452 - Core i5-10400F (65/134 W)
DDR4-2666CL1452 - Core i3-10100F (65/90 W)
DDR4-2666CL1452 - Ryzen 3 3100
DDR4-3200CL1450 - Ryzen Threadripper 2950X
DDR4-2933CL1449 - Core i5-9400F
DDR4-2666CL1449 - Ryzen 7 2700X
DDR4-2933CL1449 - Ryzen Threadripper 2920X
DDR4-2933CL1449 - Core i5-10210U
Asus PN6248 - Core i7-1065G7 (15 W)
Acer Swift 348 - Core i3-9100F
DDR4- 2666CL1448 - Ryzen 5 2600X
DDR4-2933CL1448 - Ryzen Threadripper 2990WX
DDR4-2933CL1448 - Ryzen Threadripper 2970WX
DDR4-2933CL1447 - Core i5-8400
DDR4-2666CL1447 - Ryzen 5 3400G
DDR4-3200CL1447 - Ryzen Threadripper 1920X
DDR4-2666CL1446 - Ryzen 7 2700
DDR4-2933CL1446 - Ryzen 5 2600
DDR4-2933CL1444 - Ryzen 5 1600X
DDR4-2666CL1444 - Ryzen 3 3200G
DDR4-3200CL1444 - 2x Intel Xeon Platinum 8180
DDR4-2666 (ECC, RDIMM)43 - Core i7-4770K
DDR3-160041 - Ryzen 3 2200G
DDR4-2933CL1441 - Ryzen 7 1700
DDR4-2666CL1439 - Pentium Gold 5400
DDR4-2400CL1438 - Athlon 3000G
DDR4- 2666CL1438 - Athlon 240GE
DDR4-2666CL1438 - Ryzen 3 3200U
Zotac Zbox37 - Core i7-2600K
DDR3-133334 - Athlon 200GE
DDR4-2666CL1432
li>
li>
< li class="chart__row chart__row--hidden toggle-body-item nojs-tr">Ryzen 7 1800X
DDR4-2666CL1444
Unit: percent
Performance in applications (multi-core)
As already discussed when looking at the clock speeds, the sample of the Core i9-13900KS with the current BIOS of the Asus Z790 Maximus Hero with 253 watt PL2 limit clocks only slightly higher than the Core i9-13900K with the BIOS at its start did in October 2022 – so both CPUs in the course are exactly as fast. The same applies to “open” operation, in which a 360 mm AiO was used, because the clock rate of the KS, which is then almost 130 MHz higher in longer loads, only comes into play: in longer loads.
142 Entries Edit Multi-Core – Performance Rating Inflowing Charts All None
- Multi-Core – 7-Zip
- Multi-Core – Agisoft PhotoScan Pro: Align Photos ( 84 JPEGs)
- Multi-Core – Blender Benchmark: Quick Benchmark
- Multi-Core – Cinebench R15 – Multi-Core
- Multi-Core – Cinebench R20 – Multi-Core
- Multi-Core – Corona 1.3 Benchmark
- Multi-Core – DigiCortex Simulation: BenchLarge
- Multi-Core – HandBrake
- Multi-Core – POV-Ray – Multi
-
- Ryzen Threadripper 3990X
DDR4-3200CL1487 - Ryzen Threadripper 3970X
DDR4 -3200CL1474 - Ryzen 9 7950X (230 W)
DDR5-5200CL3271 - Core i9-13900KS (open, AiO )
DDR5-5600CL3870 - Core i9-13900K (open)
DDR5-5600CL3870 - Core i9-13900KS (open)
DDR5-5600CL3870 - Core i9-13900K (253 W)
DDR5-5600CL3869 - Core i9-13900KS (253 W)
DDR5-5600CL3868 - Ryzen 9 7950X ( 142W, Eco)
DDR5-5200CL3268 - Ryzen Threadripper 3960X
DDR4-3200CL1462 - 2x Intel Xeon Platinum 8180
DDR4-2666 (ECC, RDIMM)61 - Core i9-13900KS (142 W)
DDR5-5600CL3860 - Core i9-13900K (142W)
DDR5-5600CL3860 - Ryzen 9 7950X (88W)
DDR5-5200CL3258 - Core i9-13900K (125W)
DDR5-5600CL3857 - Ryzen 9 7900X (230W)
DDR5-5200CL3256 - Ryzen 9 7900X (142W, Eco)< br>DDR5-5200CL3255
- Core i7-13700K (253W)
DDR5-5600CL3854 - Ryzen 9 5950X
DDR4 -3200CL1452 - Core i9-13900K (88W)
DDR5-5600CL3851 - Core i7-13700K (142 W)
DDR5-5600CL3850 - Ryzen 9 7900 (88 W)
DDR5-5200CL3249 - Core i9-12900KS (open, UV)
DDR5-4400CL26, -0.125 Volt49 - Ryzen 9 7900X (88W)
DDR5-5200CL3249 - Core i9-12900KS (241W)
DDR5-4400CL2649 - Ryzen 9 7950X ( 65 W)
DDR5-5200CL3249 - Core i7-13700K (125 W)
DDR5-5600CL3848 - Ryzen Threadripper 2990WX
DDR4-2933CL1448 - Core i9-12900K (241 W)
DDR5-4400CL2647 - Core i9-12900K
DDR4-3200CL1447 - Core i9-12900K (241W)
DDR4-3200CL1446 - Core i9-12900
DDR5-4400CL2646 - Core i9-12900K (125/241 W)
DDR4-3200CL1445 - Ryzen 9 3950X
DDR4-3200CL1445 - Core i5-13600K (181W)
DDR5-5600CL3644 - Core i9-13900K (65W)
DDR5 -5600CL3844 - Ryzen 9 5900X
DDR4-3200CL1443 - Core i7- 13700K (88W)
DDR5-5600CL3843 - Ryzen 9 7900X (65W)
DDR5-5200CL3243 - Core i9-10980XE
DDR4-2933CL1442 - Ryzen Threadripper 2970WX
DDR4-2933CL1441 - Ryzen 7 7700X (142W)
DDR5-5200CL3240 - Core i7-12700K
DDR5-4800CL3240 - Core i7-12700K (190W)
DDR4-3200CL1440 - Core i7-12700K (125/190W)
DDR4-3200CL1439 - Ryzen 7 7700X (88W, Eco)
DDR5-5200CL3239 - Ryzen 7 7700 (88W)
DDR5-5200CL3238 - Core i7-13700K (65W)< br>DDR5-5600CL3837
- Ryzen 7 7700X (65W)
DDR5-5200CL3237 - Ryzen 9 3900XT
DDR4-3200CL1436 - Core i9-12900K without E-Cores
DDR4-3200CL1436 - Ryzen 9 3900X
DDR4-3200CL1436 - Core i9-9980XE
DDR4-2400CL1436 - Core i9-7980XE
DDR4-2400CL1436 - Ryzen Threadripper 2950X
DDR4-2933CL1435 - Core i9-13900K (45 W)
DDR5-5600CL3834 - Core i9-12900 (65/202 W )
DDR5-4400CL2634 - Core i7-12700H (120W) AiO
XMG Neo 1534 - Core i9-7960X
DDR4-2400CL1434 - Core i9-10900K
DDR4-2933CL1433 - Core i9-10850K
DDR4-2933CL1432 - Core i7-12700H (120 W)
XMG Neo 1532 - Core i9-10900K (125/250 W)
DDR4-2933CL1432 - Ryzen 9 7950X (45W)
DDR5-5200CL3232 - Core i5-12600K
DDR4-3200CL1431 - Core i5-12600K (125/150 W)
DDR4-3200CL1431 - Ryzen 7 5800X
DDR4-3200CL1431 - Ryzen 5 7600X (142W)
DDR5-5200CL3231 - Core i5-12600K ( 150W)
DDR4-3200CL1431 - Ryzen 9 7900X (45W)
DDR5-5200CL3231 - Ryzen 5 7600X (88W, Eco)
DDR5-5200CL3231 - Ryzen 7 7700X ( 45 W)
DDR5-5200CL3231 - Ryzen 7 5800X3D
DDR4-3200CL1430 - Core i9-12900HK (65/135W)
MSI Raider GE7630 - Core i7-13700K (45W)
DDR5-5600CL3830 - Ryzen 5 7600X (65W)
DDR5-5200CL3230 - Ryzen Threadripper 2920X
DDR4-2933CL1430 - Core i5-13400F
DDR5-5600CL3229 - Ryzen 5 7600 (88W)
DDR5- 5200CL3229 - Ryzen 7 5700G
DDR4-3200CL1428 - Ryzen 7 5700X
DDR4-3200CL1428 - Core i9-11900K (125/250 W)
DDR4 -3200CL1428 - Ryzen 5 7600 (65W)
DDR5-5200CL3228 - Core i7-11700K
DDR4-2933CL1428 - Core i7-11700K (125/250 W)
DDR4-2933CL1427 - Core i7-11700 (2933G1)
DDR4-2933CL1427 - Core i9- 9900KS
DDR4-2666CL1427 - Ryzen Threadripper 1920X
DDR4-2666CL1427 - Core i9-9900X
DDR4-2400CL1427 - Ryzen 7 3800XT
DDR4-3200CL1427 - Core i7-11800H (120W)
XMG Neo 1526 - Core i9 -7900X
DDR4-2400CL1426 - Ryzen 5 7600X (45W)
DDR5-5200CL3226
li>
li>
< li class="chart__row">Core i5-13400F (65W)
DDR5-5600CL3226 - Ryzen Threadripper 3990X
- Core i7-10700K
DDR4-2666CL1426 - Ryzen 7 5800H (80 W )
XMG Core 1526 - Core i9-9900K
DDR4-2666CL1425 - Core i9-9900KS (127/159W)
DDR4-2666CL1425 - Ryzen 7 3700X
DDR4-3200CL1425 - Ryzen 9 6900HS (45 watts)
Asus ROG Zephyrus G1425 - Ryzen 9 5980HS (80W)
Asus ROG Flow X1325 - Ryzen 7 4750G Pro
DDR4-3200CL1424 - Ryzen 5 5600X
DDR4-3200CL1424 - Core i9-11900KB (65/109 W)
DDR4-3200CL1424< /li> - Ryzen 5 7600 (45W)
DDR5-5200CL3224 - Core i7 -12700H (35/60 W)
XMG Neo 1524 - Core i9-9900K (95/119 W)
DDR4-2666CL1424 - Ryzen 9 6900HS (35W)
Asus ROG Zephyrus G1423 - Core i9-11980HK (95/200W)
DDR4-3200CL1423 - Core i7- 12700H (45W)
XMG Neo 1523 - Core i5-12500
DDR4-3200CL1423 - Core i5-12500 (65/117 W)
DDR4-3200CL1422 - Ryzen 5 5600G
DDR4-3200CL1422 - Core i7-9800X
DDR4-2400CL1422 - Core i5-12400
DDR4-3200CL1422 - Core i5-12400 (65/117 W)
DDR4-3200CL1422 - Core i5-11600K (125/250LT)
DDR4-3200CL1422 - Ryzen 7 2700X
DDR4-2933CL1422 - Ryzen 5 5500
DDR4-3200CL1421 - Ryzen 9 4900HS (35 W)
Asus ROG Strix G1421 - Ryzen 9 4900HS21
- Core i5-11600K
DDR4-3200CL1421 - Core i7-11700 (65/224 W)
DDR4-2933CL1421 - Ryzen 5 3600XT
DDR4-3200CL1420 - Core i5-11400F
DDR4-2933CL1420 - Ryzen 5 3600X
DDR4-3200CL1420 - Core i7-10875H (62 W)
Aero 15 OLED20 - Core i7-10700 (65/225 W)
DDR4-2666CL1420 - Ryzen 5 3600
DDR4-3200CL1419 - Core i7-9700< br>DDR4-2666CL1419
- Core i5-10600K (125/182 W)
DDR4-2933CL1419 - Ryzen 7 1800X
DDR4-2666CL1419 - Core i9-9980HK (65/95 W)
Intel Whitebook19 - Ryzen 5 4650G Pro
DDR4-3200CL1419 - Ryzen 7 2700
DDR4-2933CL1419 - Core i7-11800H (45W)
XMG Neo 1518 - Core i7-11800H (35/60 W)
XMG Neo 1518 - Core i7-8700K
DDR4-2666CL1418 - Core i7-10875H (45 W)
Aero 15 OLED17 - Core i9-11980HK (30/200 W)
DDR4-3200CL1417 - Core i5-10400F
DDR4-2666CL1417 - Core i5-11400F (65 /154 W)
DDR4-2933CL1417 - Ryzen 7 1700
DDR4-2666CL1417 - Core i5-10400F (65/134 W)
DDR4-2666CL1417 - Ryzen 5 2600X
DDR4-2933CL1417 - Core i7-9700 (65/81 W)
DDR4-2666CL1416 - Core i3-12100F (58/89 W)
DDR4-3200CL1416 - Core i3-12100F
DDR4-3200CL1416 - Ryzen 5 2600
DDR4-2933CL1415 - Ryzen 5 1600X
DDR4-2666CL1415 - Ryzen 3 3300X
DDR4-3200CL1414 - Core i5-9400F
DDR4-2666CL1413 - Ryzen 3 3100
DDR4-3200CL1413 - Core i7-7700K
DDR4-2400CL1412 - Ryzen 3 4350G Pro
DDR4-3200CL1412 - Core i5-8400
DDR4-2666CL1412 - Core i3-10100F (65/90W)
DDR4-2666CL1412 - Ryzen 5 3400G
DDR4-3200CL1411 - Ryzen 5 2400G
DDR4-2933CL1410 - Core i7-4770K
DDR3-16009 - Core i3-9100F
DDR4-2666CL149 - Core i7-2600K
DDR3-13337 - Ryzen 3 2200G
DDR4-2933CL147 - Core i7-1065G7 (15 W)
Acer Swift 37 - Core i5-10210U
Asus PN627 - Core i7-10510U (10W)
Asus ExpertBook B9450FA6 - Athlon 3000G
DDR4-2666CL145 - Athlon 240GE
DDR4-2666CL145 - Pentium Gold 5400
DDR4-2400CL145 - Athlon 200GE
DDR4-2666CL144 - Ryzen 3 3200U
Zotac Zbox4
< li class="chart__row chart__row--hidden toggle-body-item nojs-tr">Core i7-10710U
Intel NUC13
li>
Unit: percent
It is interesting that even at 142 watts there is no measurable advantage for the KS, which indicates that the pattern of the KS and that of the K from the previous year differ little. Although Igor's Lab recently showed that the KS series does in fact have better dies than the K series, this does not necessarily mean that every KS is better than every K, because the selection is not free of overlaps.
Performance Rating
- Multi-Core
- Single-Core
71 entries Edit Multi-Core – Performance Rating Inflowing Charts All None
- Multi-Core – 7- Zip
- Multi-Core – Agisoft PhotoScan Pro: Align Photos (84 JPEGs)
- Multi-Core – Blender Benchmark: Quick Benchmark
- Multi-Core – Cinebench R15
- Multi-Core – Cinebench R20
- Multi-Core – Corona 1.3 Benchmark< /li>
- Multi-Core – DigiCortex Simulation: BenchLarge
- Multi-Core – HandBrake
- Multi-Core – POV-Ray
-
- Ryzen 9 7950X (230W)
DDR5-5200CL3298 - Core i9-13900KS (open)
DDR5-5600CL3696 - Core i9- 13900K (open)
DDR5-5600CL3696 - Core i9-13900K (253 W)
DDR5-5600CL3695 - Core i9-13900KS (253 W)
DDR5-5600CL3694 - Ryzen 9 7950X (142 W, Eco)
DDR5-5200CL3293 - Core i9-13900KS (142 W)
DDR5-5600CL3683 - Core i9-13900K (142 W)
DDR5-5600CL3682 - Ryzen 9 7950X (88W)
DDR5-5200CL3280 - Core i9-13900K (125W)
DDR5-5600CL3679 - Ryzen 9 7900X (230W)
DDR5-5200CL3277 - Ryzen 9 7900X (142 W, Eco)
DDR5-5200CL3275 - Core i7-13700K (253W)
DDR5-5600CL3675 - Ryzen 9 5950X
DDR4-3200CL1471 - Core i9-13900K (88 W)
DDR5-5600CL3670 - Core i7-13700K (142 W)
DDR5-5600CL3669 - Ryzen 9 7900 (88W)
DDR5-5200CL3268 - Ryzen 9 7900X (88W)
DDR5-5200CL3268 - Ryzen 9 7950X (65 W)
DDR5-5200CL3267 - Core i7-13700K( 125 W)
DDR5 -5600CL3666 - i9-12900K (open)
DDR4-3200CL1464 - i9-12900K (125/241 W)
DDR4-3200CL1463 - Core i5-13600K ( 181 W)
DDR5-5600CL3661 - Core i9-13900K (65 W)
DDR5-5600CL3660 - Core i5-13600K (142 W)
DDR5-5600CL3660 - Ryzen 9 5900X
DDR4-3200CL1459 - Core i7-13700K (88W)
DDR5-5600CL3659 - Ryzen 9 5950X (88W, Eco)
DDR4-3200CL1459 - Ryzen 9 7900X (65W)
DDR5-5200CL3259 - Core i5-13600K (125W)
DDR5-5600CL3659 - i9-12900K (125W)
DDR4-3200CL1459 - Ryzen 7 7700X (142 W)
DDR5-5200CL3256 - Ryzen 9 5900X (88W, Eco)
DDR4-3200CL1455 - Core i5-13600K (88W)
DDR5-5600CL3654 - Ryzen 7 7700X (88W, Eco)
DDR5-5200CL3254 - Ryzen 7 7700 (88W)
DDR5-5200CL3252 - Core i7-13700K (65W)
DDR5-5600CL3652 - i9-12900K (88W)
DDR4-3200CL1451 - Ryzen 7 7700X (65W)
DDR5-5200CL3251 - Core i5-13600K (65W)
DDR5-5600CL3649 - Core i9-13900K ( 45 W)
DDR5-5600CL3648 - i9-10900K (open)
DDR4-2933CL1445
< li class="chart__row chart__row--hidden toggle-body-item nojs-tr">i9-12900K (65W)
DDR4-3200CL1444 - Ryzen 9 7950X (230W)
- i9-10900K (125/250W)
DDR4 -2933CL1444 - Ryzen 9 7950X (45W)
DDR5-5200CL3244 - Ryzen 7 5800X
DDR4-3200CL1443 - Ryzen 5 7600X ( 142W)
DDR5-5200CL3243 - i9-11900K (open)
DDR4-3200CL1443 - Ryzen 9 7900X (45 W)
DDR5-5200CL3243 - Ryzen 5 7600X (88 W, Eco)
DDR5-5200CL3243 - Ryzen 7 7700X (45W)
DDR5-5200CL3243 - Ryzen 7 5800X (88W, Eco)
DDR4-3200CL1441 - Core i5-13600K (45W)
DDR5-5600CL3641 - Ryzen 5 7600X (65W)
DDR5-5200CL3241 - Ryzen 5 7600 (88W)
DDR5-5200CL3240 - Ryzen 7 5700X
DDR4-3200CL1439 - i9-11900K (125/250 W)
DDR4-3200CL1439 - i7-11700K (125/250 W )
DDR4-2933CL1438 - Ryzen 5 7600X (45W)
DDR5-5200CL3236 - i7-10700K (open)
DDR4-2933CL1436 - i9-9900K (open)
DDR4-2666CL1435 - Ryzen 9 6900HS (45 W)
Asus ROG Zephyrus G1435 - Ryzen 5 5600X
DDR4-3200CL1433 - i9-9900K (95/119 w)
DDR4-2666CL1433 - Ryzen 5 5600X (60W, Eco)
DDR4-3200CL1432 - i5-11600K (125/250W)
DDR4-2933CL1430 - i5- 11600K (open)
DDR4-2933CL1429 - i5-10600K (open)
DDR4-2933CL1426 - i5-10600K (125/182 W)
DDR4-2933CL1426 - i7-8700K (open)
DDR4- 2666CL1425 - i5-10400F (65/134 W)
DDR4-2933CL1423 - i5-9400F (open)
DDR4-2666CL1418 - i7-7700K (open)
DDR4-2400CL1417 - i5-8400 (open)
DDR4-2666CL1417 - i7-4770K (open)
DDR3-160013 - i7-2600K (open)
DDR3-133310
< li class="chart__row chart__row--hidden toggle-body-item nojs-tr">Core i7-13700K (45W)
DDR5-5600CL3641
li>
Unit: Percentage 71 entries Edit Single-Core – Performance Rating Input Charts All None
- Single- Core – Cinebench R15
- Single Core – Cinebench R20
- Single Core – POV-Ray
-
- Core i9-13900KS (open)
DDR5-5600CL36100 - Core i9-13900KS (253 W)
DDR5-5600CL36100 - Core i9-13900KS (142 W)
DDR5-5600CL3699 - Core i9-13900K (253 W)
DDR5-5600CL3697 - Core i9-13900K (65W)
DDR5-5600CL3697 - Core i9-13900K (142 W)
DDR5-5600CL3697 - Core i9-13900K (open)
DDR5-5600CL3697 - Core i9-13900K (45W)
DDR5-5600CL3697 - Core i9-13900K (88W)
DDR5-5600CL3697 - Core i9-13900K (125W)
DDR5-5600CL3697 - Core i7-13700K (253W)
DDR5-5600CL3690 - Ryzen 9 7950X ( 65W)
DDR5-5200CL3290 - Ryzen 9 7950X (142W, Eco)
DDR5-5200CL3290 - Ryzen 9 7950X (230W)
DDR5-5200CL3290 - Core i7-13700K (88W)
DDR5-5600CL3690 - Ryzen 9 7950X (88 W)
DDR5-5200CL3290 - Core i7-13700K (45W)
DDR5-5600CL3690 - Ryzen 9 7900X (142W, Eco)
DDR5-5200CL3290 - Core i7-13700K (65W)
DDR5-5600CL3690 - Core i7-13700K (142 W)
DDR5-5600CL3690 - Ryzen 9 7900X (230W)
DDR5-5200CL3290 - Ryzen 9 7900X (88W)
DDR5-5200CL3290 - Core i7-13700K( 125 W)
DDR5-5600CL3690 - Ryzen 9 7900X (65W)
DDR5-5200CL3289 - Ryzen 9 7900X (45 W)
DDR5-5200CL3289 - Ryzen 9 7950X (45W)
DDR5-5200CL3289
< li class="chart__row chart__row--hidden toggle-body-item nojs-tr">Ryzen 7 7700X (88W, Eco)
DDR5-5200CL3289 - Core i9-13900KS (open)
- Ryzen 7 7700X (142W)
DDR5 -5200CL3288 - Ryzen 7 7700X (65W)
DDR5-5200CL3288 - Ryzen 7 7700X (45W)
DDR5-5200CL3288 - Ryzen 5 7600X (45W)
DDR5-5200CL3287 - Ryzen 9 7900 (88W)
DDR5-5200CL3287 - Ryzen 5 7600X (88W, Eco)
DDR5-5200CL3287 - Ryzen 5 7600X ( 65W)
DDR5-5200CL3286 - Ryzen 5 7600X (142W)
DDR5-5200CL3286 - Core i5-13600K (181W)
DDR5-5600CL3686 - Core i5-13600K (65W)
DDR5 -5600CL3686 - Core i5-13600K (45W)
DDR5-5600CL3685 - Core i5-13600K (88W)
DDR5-5600CL3685 - Core i5-13600K (142W)
DDR5-5600CL3685 - Core i5-13600K (125W)
DDR5-5600CL3685 - i9-12900K (65 W)
DDR4-3200CL1484 - i9-12900K (88 W)
DDR4-3200CL1484 - i9-12900K (125 W)
DDR4-3200CL1484 - i9-12900K (open)
DDR4-3200CL1484 - Ryzen 7 7700 (88 W)
DDR5-5200CL3283 - i9-12900K (125/241 W)
DDR4-3200CL1483 - Ryzen 5 7600 (88W)
DDR5-5200CL3282 - i9-11900K (open)
DDR4-3200CL1474 - i9-11900K (125/250 W)
DDR4-3200CL1474 - Ryzen 9 5900X (88 W, Eco)
DDR4-3200CL1473 - Ryzen 9 5900X
DDR4-3200CL1473 - Ryzen 7 5800X
DDR4-3200CL1472 - Ryzen 9 5950X (88W, Eco)
DDR4-3200CL1472 - Ryzen 7 5800X (88W, Eco)
DDR4-3200CL1472 - Ryzen 5 5600X (60 W , Eco)
DDR4-3200CL1469 - Ryzen 5 5600X
DDR4-3200CL1469 - Ryzen 9 6900HS (45 W)
Asus ROG Zephyrus G1469 - i7-11700K (125/250 W)
DDR4-2933CL1469 - i5-11600K (open)
DDR4-2933CL1468 - i5-11600K (125/250W)
DDR4-2933CL1468 - i9-10900K (125/250W)
DDR4-2933CL1463 - i9-10900K (open)
DDR4-2933CL1463 - i7-10700K (open)
DDR4-2933CL1462 - i9-9900K (95/119W)
DDR4-2666CL1460 - i9-9900K (open)
DDR4-2666CL1460 - i5-10600K (125/182 W)
DDR4-2933CL1458 - i5-10600K (open )
DDR4-2933CL1458 - i7-8700K (open)
DDR4-2666CL1456 - i7-7700K (open)
DDR4-2400CL1453 - i5-10400F (65/134 W)
DDR4- 2933CL1452 - i5-9400F (open)
DDR4-2666CL1449 - i7-4770K (open)
DDR3-160041 - i7-2600K (open)
DDR3-133334
< li class="chart__row chart__row--hidden toggle-body-item nojs-tr">Ryzen 9 5950X
DDR4-3200CL1474
li>
Unit: Percentage
In the editorial team's multi-core test course, the 13900KS can't ultimately benefit from being a KS, because under the general conditions of temperature and consumption limits it doesn't clock significantly higher than the pattern of the 13900K.
Performance in games (720p)
The gap between the Core i9-13900K and Core i9-13900KS is also smaller when playing games than in the single-core course: the KS model can differ by 1 percent from the K model in both average FPS and percentile frame times drop. This matches the clock increase of 100 MHz in the tested games (5.6 to 5.5 GHz, 1.81 percent), which is half as large as the 200 MHz with maximum turbo (3.44 percent).
Performance rating- Rasterizer, AVG FPS
- Rasterizer, Percentile FPS
Edit Performance rating – Rasterizer, AVG-FPS Inflow charts All None
- Cyberpunk 2077 + RT – 1,280 × 720: FPS, Average
- DOTA 2 – 1,280 × 720: FPS, Average
- Death Stranding – 1280 × 720: FPS, Average
- Far Cry 6 + RT – 1280 × 720: FPS, Average
- Ghostwire Tokyo – 1280×720: FPS, Average
- Resident Evil Village – 1280×720: FPS, Average
- Spider Man Remastered – 1280×720: FPS, Average
-
- Intel Core i9-13900KS
8P+16E, DDR5-5600CL3299.7 - Intel Core i9-13900K
8P+16E, DDR5-5600CL3298.9 - Intel Core i5-13600K
6P+8E, DDR5-5600CL3289.0 - AMD Ryzen 7 5800X3D
8 Zen 3D, DDR4-3200CL1485.6 - AMD Ryzen 9 7900X
12 Zen 4, DDR5-5200CL3281.3 - AMD Ryzen 7 7700X
8 Zen 4, DDR5-5200CL3280,8 - AMD Ryzen 9 7900
12 Zen 4, DDR5-5200CL3279,7 - AMD Ryzen 7 7700
8 Zen 4, DDR5-5200CL3278,7 - AMD Ryzen 5 7600X
6 Zen 4, DDR5-5200CL3276.5 - AMD Ryzen 5 7600
6 Zen 4, DDR5-5200CL3274.0 - Intel Core i5-13400F, RAM OC
6P+4E, DDR5-5600CL3273,9 - Intel Core i5-12600K
6P+4E , DDR5-4800CL3273,5 - Intel Core i5-13400F
6P+4E, DDR5-4800CL3270,1 - Intel Core i5 -12500
6P+0E, DDR5-4800CL3267.4 - AMD Ryzen 7 5800X
8 Zen 3, DDR4-3200CL1465.3 - Intel Core i3-12100F
4P+0E, DDR5-4800CL3256.8
- Intel Core i9-13900KS
Unit: Percent Edit Performance rating – rasterizer, percentile FPS Inflow charts All None
- Cyberpunk 2077 + RT – 1,280 × 720: FPS, 1% percentile
- DOTA 2 – 1280×720: FPS, 1% percentile
- Death Stranding – 1280×720: FPS, 1% percentile
- Far Cry 6 + RT – 1280×720 : FPS, 1% percentile
- Ghostwire Tokyo – 1280×720: FPS, 1% percentile
- Resident Evil Village – 1280×720: FPS, 1% percentile
- Spider Man Remastered – 1280×720: FPS, 1st % percentile
-
- Intel Core i9-13900KS
8P+16E, DDR5-5600CL3299.5 - Intel Core i9 -13900K
8P+16E, DDR5-5600CL3298.8 - Intel Core i5-13600K
6P+8E, DDR5-5600CL3286.6 - AMD Ryzen 7 5800X3D
8 Zen 3D, DDR4-3200CL1479.8
< li class="chart__row">AMD Ryzen 9 7900X
12 Zen 4, DDR5-5200CL3279,8 - Intel Core i9-13900KS
- AMD Ryzen 7 7700X
8 Zen 4, DDR5-5200CL3279, 7 - AMD Ryzen 9 7900
12 Zen 4, DDR5-5200CL3277,6 - AMD Ryzen 7 7700
8 Zen 4, DDR5-5200CL3277,4 - Intel Core i5-13400F, RAM OC
6P+4E, DDR5-5600CL3274,3 - AMD Ryzen 5 7600X
6 Zen 4, DDR5-5200CL3274,1 - Intel Core i5-12600K
6P+4E, DDR5-4800CL3274.0 - AMD Ryzen 5 7600
6 Zen 4, DDR5-5200CL3272.4 - Intel Core i5-13400F
6P+4E, DDR5-4800CL3270,4 - Intel Core i5-12500
6P+0E, DDR5-4800CL3267 ,1 - AMD Ryzen 7 5800X
8 Zen 3, DDR4-3200CL1462,9 - Intel Core i3-12100F
4P+0E, DDR5-4800CL3255.5
Unit: percent
The 12900KS could 2 percent more in this discipline, but also increased the “game clock” by 300 MHz (6 percent) from 4.9 to 5.2 GHz. So the air was also very thin in games for the KS this year.
Depending on the game, the 100 MHz more clock on 8 P-cores have a small to larger influence on the power consumption (package power according to HWiNFO): From parity to an additional 30 watts, everything is represented on the course.
1,280 × 720
- Cyberpunk 2077 + RT
- Death Stranding
- DOTA 2
- Far Cry 6 + RT
- Ghostwire Tokyo
- Resident Evil Village
- Spider Man Remastered
Cyberpunk 2077 + RT – 1,280 × 720
- FPS, Average:
- Intel Core i9-13900KS
8P+16E, DDR5-5600CL32115,4 - Intel Core i9 -13900K
8P+16E, DDR5-5600CL32112.8 - Intel Core i5-13600K
6P+8E, DDR5-5600CL32100.6 - Intel Core i5-13400F, RAM OC
6P+4E, DDR5-5600CL3285,4 - Intel Core i5-12600K
6P+4E, DDR5-4800CL3283.4 - AMD Ryzen 9 7900X
12 Zen 4, DDR5-5200CL3282.0 - Intel Core i5-13400F
6P+4E, DDR5-4800CL3280,6 - AMD Ryzen 5 7600X
6 Zen 4, DDR5- 5200CL3280,3 - AMD Ryzen 7 5800X3D
8 Zen 3D, DDR4-3200CL1480,2 - AMD Ryzen 9 7900
12 Zen 4, DDR5-5200CL3279,5 - AMD Ryzen 5 7600
6 Zen 4, DDR5-5200CL3279,4 - AMD Ryzen 7 7700X
8 Zen 4, DDR5-5200CL3279,3 - AMD Ryzen 7 7700
8 Zen 4, DDR5-5200CL3278,7 - Intel Core i5-12500
6P+0E, DDR5-4800CL3277,8 - AMD Ryzen 7 5800X
8 Zen 3, DDR4-3200CL1463.9 - Intel Core i3-12100F
4P+0E, DDR5-4800CL3263.6
< li class="chart__row">Intel Core i5-11600K
4K/8T, DDR4-3200CL1456.9 - Intel Core i9-13900KS
- Intel Core i9-13900KS
8P+16E, DDR5-5600CL3298.3 - Intel Core i9-13900K
8P+16E, DDR5-5600CL3297.3
< li class="chart__row">Intel Core i5-13600K
6P+8E, DDR5-5600CL3273,7
12 Zen 4, DDR5-5200CL3270 ,3
6P+4E, DDR5-5600CL3270,1
6P+4E, DDR5-4800CL3269.5
6P+4E, DDR5-4800CL3268,6
8 Zen 4, DDR5-5200CL3268,1
12 Zen 4, DDR5-5200CL3267,7
6 Zen 4, DDR5-5200CL3267,3
8 Zen 4, DDR5-5200CL3267.0
6 Zen 4, DDR5-5200CL3267.0< /li>
8 Zen 3D, DDR4-3200CL1464,7
6P+0E, DDR5-4800CL3264.1
8 Zen 3, DDR4-3200CL1453.6
< li class="chart__row">Intel Core i3-12100F
4P+0E, DDR5-4800CL3251,6
4K/8T, DDR4- 3200CL1444,9
Unit: frames per second (FPS) Death Stranding – 1,280 × 720
- FPS, Average:
- Intel Core i9-13900KS
8P+16E, DDR5-5600CL32238,9 - Intel Core i9 -13900K
8P+16E, DDR5-5600CL32238.9 - Intel Core i5-13600K
6P+8E, DDR5-5600CL32229.7 - AMD Ryzen 9 7900X
12 Zen 4, DDR5-5200CL32210,1 - AMD Ryzen 7 7700X
8 Zen 4, DDR5- 5200CL32208,6 - AMD Ryzen 9 7900
12 Zen 4, DDR5-5200CL32206,1 - AMD Ryzen 7 7700
8 Zen 4, DDR5-5200CL32201,4 - Intel Core i5-12600K
6P+4E, DDR5- 4800CL32201,3 - Intel Core i5-13400F, RAM OC
6P+4E, DDR5-5600CL32197,0 - Intel Core i5-13400F
6P+4E, DDR5-4800CL32190,7 - AMD Ryzen 7 5800X3D
8 Zen 3D, DDR4-3200CL14189,7 - Intel Core i5-12500
6P+0E, DDR5-4800CL32187.0 - AMD Ryzen 5 7600X
6 Zen 4, DDR5-5200CL32185.7 - AMD Ryzen 5 7600
6 Zen 4, DDR5-5200CL32173.9 - AMD Ryzen 7 5800X
8 Zen 3, DDR4-3200CL14166,9 - Intel Core i3-12100F
4P+0E, DDR5-4800CL32160, 1 - Intel Core i5-11600K
4K/8T, DDR4-3200CL14135.6
- Intel Core i9-13900KS
- FPS, 1% percentile:
- Intel Core i9-13900K
8P+16E, DDR5-5600CL32211.0 - Intel Core i9-13900KS
8P+ 16E, DDR5-5600CL32210.0 - Intel Core i5-13600K
6P+8E, DDR5-5600CL32199.3 - AMD Ryzen 9 7900X
12 Zen 4, DDR5-5200CL32183.7 - AMD Ryzen 7 7700X
8 Zen 4, DDR5-5200CL32179.0 - AMD Ryzen 9 7900
12 Zen 4, DDR5-5200CL32177.0 - Intel Core i5-12600K
6P+4E, DDR5-4800CL32174,2 - AMD Ryzen 7 7700
8 Zen 4, DDR5-5200CL32171,0 - Intel Core i5-13400F, RAM OC
6P+4E, DDR5-5600CL32166,6 - Intel Core i5-13400F
6P+4E, DDR5-4800CL32162,6< /li> - AMD Ryzen 7 5800X3D
8 Zen 3D, DDR4-3200CL14159,7 - AMD Ryzen 5 7600X
6 Zen 4, DDR5-5200CL32157,7 - Intel Core i5-12500
6P+0E, DDR5-4800CL32154,1 - AMD Ryzen 5 7600
6 Zen 4, DDR5-5200CL32145,5 - AMD Ryzen 7 5800X
8 Zen 3, DDR4-3200CL14140 ,1 - Intel Core i3-12100F
4P+0E, DDR5-4800CL32122,3 - Intel Core i5-11600K
4K/8T, DDR4-3200CL14108.0
- Intel Core i9-13900K
Unit: frames per second (FPS) DOTA 2 – 1,280 × 720
- FPS, Average:
- Intel Core i9-13900K
8P+16E, DDR5-5600CL32308.0 - Intel Core i9-13900KS
8P+16E, DDR5-5600CL32307,7 - AMD Ryzen 7 5800X3D
8 Zen 3D, DDR4-3200CL14299,7 - AMD Ryzen 9 7900X
12 Zen 4, DDR5-5200CL32282,5 - AMD Ryzen 9 7900
12 Zen 4, DDR5-5200CL32265.5 - Intel Core i5-13600K
6P+8E, DDR5-5600CL32259.9 - AMD Ryzen 7 7700X
8 Zen 4, DDR5-5200CL32250.1
< li class="chart__row">AMD Ryzen 7 7700
8 Zen 4, DDR5-5200CL32248,2 - Intel Core i9-13900K
- AMD Ryzen 5 7600X
6 Zen 4, DDR5-5200CL32226, 7 - AMD Ryzen 5 7600
6 Zen 4, DDR5-5200CL32216,3 - AMD Ryzen 7 5800X
8 Zen 3, DDR4-3200CL14213,5 - Intel Core i5-13400F, RAM OC
6P+4E, DDR5-5600CL32209,2 - Intel Core i5-12600K
6P+4E, DDR5-4800CL32207,4 - Intel Core i5-13400F
6P+4E, DDR5 -4800CL32188,2 - Intel Core i5-12500
6P+0E, DDR5-4800CL32172,3 - Intel Core i5-11600K
4K/8T, DDR4-3200CL14135.3 - Intel Core i3-12100F
4P+0E, DDR5-4800CL32128.8
< /li>
- Intel Core i9-13900K
8P+16E, DDR5-5600CL32178,1 - Intel Core i9-13900KS
8P+16E, DDR5-5600CL32172,7 - AMD Ryzen 7 5800X3D
8 Zen 3D, DDR4-3200CL14164,5 - Intel Core i5-13600K
6P+8E, DDR5-5600CL32158.8 - AMD Ryzen 9 7900X
12 Zen 4, DDR5-5200CL32151.4
< li class="chart__row">AMD Ryzen 9 7900
12 Zen 4, DDR5-5200CL32141,7
8 Zen 4, DDR5-5200CL32137,1
8 Zen 4, DDR5-5200CL32135 ,8
6P+4E, DDR5-5600CL32129,2
6P+4E, DDR5-4800CL32128,0
6 Zen 4, DDR5-5200CL32124,4
6 Zen 4, DDR5-5200CL32120,7
6P+4E, DDR5-4800CL32114,7
8 Zen 3, DDR4-3200CL14113,5
6P+0E, DDR5-4800CL32107.6
4K/8T, DDR4-3200CL1486.2
< li class="chart__row">Intel Core i3-12100F
4P+0E, DDR5-4800CL3286.0
Unit: frames per second (FPS) Far Cry 6 + RT – 1,280 × 720
- FPS, average:
- Intel Core i9-13900KS
8P+16E, DDR5 -5600CL32145,6 - Intel Core i9-13900K
8P+16E, DDR5-5600CL32145,1 - AMD Ryzen 7 5800X3D
8 Zen 3D, DDR4-3200CL14137.2 - Intel Core i5-13600K
6P+8E, DDR5-5600CL32136.1 - AMD Ryzen 7 7700X
8 Zen 4, DDR5-5200CL32120,4 - AMD Ryzen 9 7900
12 Zen 4, DDR5-5200CL32117,8 - AMD Ryzen 7 7700
8 Zen 4, DDR5-5200CL32116 ,9 - AMD Ryzen 9 7900X
12 Zen 4, DDR5-5200CL32116,7 - AMD Ryzen 5 7600X
6 Zen 4, DDR5-5200CL32115.0 - Intel Core i5-12600K
6P+4E, DDR5-4800CL32114.5 - Intel Core i5-13400F, RAM OC
6P+4E, DDR5-5600CL32113.0 - AMD Ryzen 5 7600
6 Zen 4, DDR5-5200CL32112.1 - Intel Core i5-13400F
6P+4E, DDR5-4800CL32106.9
< li class="chart__row">AMD Ryzen 7 5800X
8 Zen 3, DDR4-3200CL14103,2 - Intel Core i9-13900KS
- Intel Core i5-12500
6P+0E, DDR5-4800CL32102 ,7 - Intel Core i3-12100F
4P+0E, DDR5-4800CL3294,2
- Intel Core i9-13900KS
8P+16E, DDR5-5600CL32117.7 - Intel Core i9-13900K
8P+16E, DDR5-5600CL32115.4 - AMD Ryzen 7 5800X3D
8 Zen 3D, DDR4-3200CL14108,6 - Intel Core i5-13600K
6P+8E, DDR5-5600CL32106,3 - AMD Ryzen 7 7700X
8 Zen 4, DDR5-5200CL32101,1 - AMD Ryzen 9 7900< br>12 Zen 4, DDR5-5200CL3297.8
- AMD Ryzen 9 7900X
12 Zen 4, DDR5-5200CL3297,2 - AMD Ryzen 7 7700
8 Zen 4, DDR5-5200CL3296,4 - Intel Core i5-12600K
6P+4E, DDR5-4800CL3295.9 - Intel Core i5-13400F, RAM OC
6P+4E, DDR5-5600CL3292.9< /li> - AMD Ryzen 5 7600X
6 Zen 4, DDR5-5200CL3292,5 - AMD Ryzen 5 7600
6 Zen 4, DDR5-5200CL3290,3 - Intel Core i5-13400F
6P+4E, DDR5-4800CL3285,9 - Intel Core i5-12500
6P+0E, DDR5-4800CL3283,7 - AMD Ryzen 7 5800X
8 Zen 3, DDR4- 3200CL1482.1 - Intel Core i3-12100F
4P+0E, DDR5-4800CL3277.1
Unit: Frames per second (FPS) Ghostwire Tokyo – 1,280 × 720
- FPS, average:
- Intel Core i9-13900KS
8P+16E, DDR5-5600CL32215.2 - Intel Core i9-13900K
8P+ 16E, DDR5-5600CL32212,1 - Intel Core i5-13600K
6P+8E, DDR5-5600CL32200,5 - AMD Ryzen 7 5800X3D
8 Zen 3D, DDR4-3200CL14193,3 - AMD Ryzen 9 7900
12 Zen 4, DDR5-5200CL32173,8 - AMD Ryzen 9 7900X
12 Zen 4, DDR5-5200CL32173,2 - AMD Ryzen 7 7700X
8 Zen 4, DDR5-5200CL32170,5 - AMD Ryzen 7 7700
8 Zen 4, DDR5-5200CL32166,8 - AMD Ryzen 5 7600X
6 Zen 4, DDR5-5200CL32165.7 - Intel Core i5-13400F, RAM-OC
6P+4E, DDR5-5600CL32165.5 - Intel Core i5-12600K
6P+4E, DDR5-4800CL32161,2 - AMD Ryzen 5 7600
6 Zen 4, DDR5-5200CL32160,3 - Intel Core i5-13400F
6P+4E, DDR5-4800CL32155,5 - Intel Core i5-12500
6P+0E, DDR5-4800CL32149,1 - AMD Ryzen 7 5800X
8 Zen 3, DDR4- 3200CL14130,1 - Intel Core i3-12100F
4P+0E, DDR5-4800CL32129,1 - Intel Core i5-11600K< br>4K/8T, DDR4-3200CL14105.7
li>
- Intel Core i9-13900KS
- FPS, 1% percentile:
- Intel Core i9-13900KS
8P+16E, DDR5-5600CL32103.9 - Intel Core i9-13900K
8P+16E, DDR5-5600CL32102.6 - Intel Core i5-13600K< br>6P+8E, DDR5-5600CL3290,2
- AMD Ryzen 9 7900X
12 Zen 4, DDR5-5200CL3282,3 - AMD Ryzen 9 7900
12 Zen 4, DDR5-5200CL3280.4 - AMD Ryzen 7 7700
8 Zen 4, DDR5-5200CL3279.9
< li class="chart__row">Intel Core i5-13400F, RAM OC
6P+4E, DDR5-5600CL3279.0 - Intel Core i9-13900KS
- AMD Ryzen 7 7700X
8 Zen 4, DDR5-5200CL3278.4 - AMD Ryzen 5 7600
6 Zen 4, DDR5-5200CL3274.5 - AMD Ryzen 5 7600X
6 Zen 4, DDR5-5200CL3273,9 - Intel Core i5-12600K
6P+4E, DDR5-4800CL3273, 2 - Intel Core i5-13400F
6P+4E, DDR5-4800CL3272.9 - AMD Ryzen 7 5800X3D
8 Zen 3D, DDR4-3200CL1471.9 - Intel Core i5-12500
6P+0E, DDR5-4800CL3268.9 - AMD Ryzen 7 5800X
8 Zen 3, DDR4-3200CL1459.4 - Intel Core i3-12100F
4P+0E, DDR5-4800CL3256.9 - Intel Core i5-11600K
4K/8T, DDR4-3200CL1449.2
< /ul>
Unit: frames per second (FPS) Resident Evil Village – 1,280 × 720
- FPS, Average:
- AMD Ryzen 7 5800X3D
8 Zen 3D, DDR4-3200CL14438.3 - Intel Core i9-13900KS
8P+16E, DDR5-5600CL32431 ,0 - Intel Core i9-13900K
8P+16E, DDR5-5600CL32426,0 - AMD Ryzen 7 7700X
8 Zen 4, DDR5-5200CL32397.4 - AMD Ryzen 7 7700
8 Zen 4, DDR5-5200CL32372.5 - AMD Ryzen 5 7600X
6 Zen 4, DDR5-5200CL32367,3 - Intel Core i5-13600K
6P+8E, DDR5-5600CL32366.2 - AMD Ryzen 9 7900X
12 Zen 4, DDR5-5200CL32362.1
< li class="chart__row">AMD Ryzen 5 7600
6 Zen 4, DDR5-5200CL32357,7 - AMD Ryzen 7 5800X3D
- AMD Ryzen 9 7900
12 Zen 4, DDR5-5200CL32354, 2 - AMD Ryzen 7 5800X
8 Zen 3, DDR4-3200CL14324,8 - Intel Core i5-13400F, RAM OC
6P+4E, DDR5-5600CL32287.7 - Intel Core i5-12600K
6P+4E, DDR5-4800CL32283,7 - Intel Core i5-13400F
6P+4E, DDR5-4800CL32275,6 - Intel Core i5-12500
6P+0E, DDR5-4800CL32272.3 - Intel Core i3-12100F
4P+0E, DDR5-4800CL32234.6 - Intel Core i5-11600K
4K/8T, DDR4-3200CL14183.7
- Intel Core i9-13900KS
8P+16E, DDR5-5600CL32325,1 - AMD Ryzen 7 5800X3D
8 Zen 3D, DDR4-3200CL14323,4 - < strong>Intel Core i9-13900K
8P+16E, DDR5-5600CL32317,3 - AMD Ryzen 7 7700X
8 Zen 4, DDR5-5200CL32292, 8 - Intel Core i5-13600K
6P+8E, DDR5-5600CL32278.0 - AMD Ryzen 7 7700
8 Zen 4, DDR5-5200CL32272.8 - AMD Ryzen 5 7600X
6 Zen 4, DDR5-5200CL32268,9 - AMD Ryzen 9 7900X
12 Zen 4, DDR5-5200CL32266,3 - AMD Ryzen 9 7900
12 Zen 4, DDR5-5200CL32266,2 - AMD Ryzen 5 7600
6 Zen 4, DDR5-5200CL32261,3 - AMD Ryzen 7 5800X
8 Zen 3, DDR4-3200CL14236,5 - Intel Core i5-13400F, RAM OC
6P+4E, DDR5 -5600CL32226,9 - Intel Core i5-12600K
6P+4E, DDR5-4800CL32222,6 - Intel Core i5-13400F
6P+4E, DDR5-4800CL32215.9 - Intel Core i5-12500
6P+0E, DDR5-4800CL32210.3 - Intel Core i3-12100F
4P+0E, DDR5-4800CL32185,5 - Intel Core i5-11600K
4K/8T, DDR4 -3200CL14130,3
Unit: frames per second (FPS) Spider Man Remastered – 1,280 × 720
- FPS, Average:
- Intel Core i9-13900KS
8P+16E, DDR5-5600CL32133.4 - Intel Core i9-13900K
8P+16E, DDR5-5600CL32132,2 - Intel Core i5-13600K< br>6P+8E, DDR5-5600CL32114,8
- AMD Ryzen 7 7700X
8 Zen 4, DDR5-5200CL32103,5 - AMD Ryzen 9 7900X
12 Zen 4, DDR5-5200CL32102,9 - AMD Ryzen 7 7700
8 Zen 4, DDR5-5200CL32101,8 - AMD Ryzen 9 7900
12 Zen 4, DDR5-5200CL32100,9 - AMD Ryzen 5 7600X
6 Zen 4, DDR5-5200CL32100.5 - Intel Core i5-13400F, RAM-OC
6P+4E, DDR5-5600CL3299.3 - Intel Core i5-12600K
6P+4E, DDR5-4800CL3299,2 - AMD Ryzen 5 7600
6 Zen 4, DDR5-5200CL3298,8 - AMD Ryzen 7 5800X3D
8 Zen 3D, DDR4-3200CL1498,5 - Intel Core i5-13400F
6P+4E, DDR5-4800CL3297.2 - Intel Core i5-12500
6P+0E, DDR5 -4800CL3293,8 - AMD Ryzen 7 5800X
8 Zen 3, DDR4-3200CL1479,7 - Intel Core i3-12100F< br>4P+0E, DDR5-4800CL3279.0
- Intel Core i5-11600K
4K/8T, DDR4-3200CL1468.2
li>
- Intel Core i9-13900KS
- FPS, 1% percentile:
- Intel Core i9-13900KS
8P+16E, DDR5-5600CL32110.9 - Intel Core i9-13900K
8P+ 16E, DDR5-5600CL32109,3 - Intel Core i5-13600K
6P+8E, DDR5-5600CL3296,0 - AMD Ryzen AMD Ryzen 7 7700
8 Zen 4, DDR5-5200CL3282.6 - AMD Ryzen 5 7600X
6 Zen 4, DDR5-5200CL3282.1 - Intel Core i5-12600K
6P+4E, DDR5-4800CL3282.1 - AMD Ryzen 5 7600
6 Zen 4, DDR5-5200CL3281.8
< li class="chart__row">Intel Core i5-13400F, RAM-OC
6P+4E, DDR5-5600CL3281.0 - Intel Core i9-13900KS
- AMD Ryzen 9 7900X
12 Zen 4 , DDR5-5200CL3280,8 - Intel Core i5-13400F
6P+4E, DDR5-4800CL3280,8 - AMD Ryzen 7 5800X3D
8 Zen 3D, DDR4-3200CL1478.5 - AMD Ryzen 9 7900
12 Zen 4, DDR5-5200CL3277.6 - Intel Core i5-12500
6P+0E, DDR5-4800CL3277.0 - AMD Ryzen 7 5800X
8 Zen 3, DDR4-3200CL1464.8 - Intel Core i3-12100F
4P+0E, DDR5-4800CL3260.1
< li class="chart__row">Intel Core i5-11600K
4K/8T, DDR4-3200CL1449.8
Unit: frames per second (FPS)
For comparison, the clock rates and consumption values of the AMD Ryzen 7000 in the test course are shown below.
Power consumption< /h3>
Strictly according to the specifications, the Intel Core i9-13900KS behaves like a 13900K – at the maximum of 253 watts it is blocked.
If the CPU is again operated openly, with 535 watts to 465 watts in the first test and 347 to 315 watts in the second analysis for the open 13900KS in comparison to the 13900K, which is also already being operated without a power limit, there is a considerable premium for about 60 to 130MHz multi-core clock. Round 10 to, in the worst case, 15 percent more is no problem for the KS.
Power consumption
- AVX load (PC)
- Full load (CPU Package Power)
- Full load (PC)
- Partial load (PC)
- Idle (PC)
82 entries Power Consumption – AVX Load (PC)
- Prime95 29.8 (Small FFTs max. Power/Heat):
- Athlon 200GE
DDR4-2666CL1457 - Athlon 240GE
DDR4-2666CL1463 - Athlon 3000G
DDR4-2666CL1468 - Core i7-10710U
Intel NUC100 - Ryzen 3 2200G
DDR4-2933CL14106 - Core i3-10100F (65/90 W)
DDR4-2666CL14106Peak 129W, then PL1 takes effect - Core i7-9700 (65/81 W)
DDR4-2666CL14111clock reduced to 2.9-3.0 GHz - Core i5-11400F (65/154 W)
DDR4-2933CL14112Peak 251 W, then PL1 takes effect - Ryzen 5 5500
DDR4-3200CL14115 - Ryzen 3 3200G
DDR4-3200CL14115
< li class="chart__row chart__row--hidden toggle-body-item nojs-tr">Core i3-12100F (58/89 W)
DDR4-3200CL14116Peak 135W, then PL1 takes effect - Athlon 200GE
- Core i3-9100F
DDR4-2666CL14117 - Ryzen 5 2400G
DDR4-2933CL14119 - Ryzen 3 4350G Pro
DDR4-3200CL14120 - Core i9-11900KB (65/109 W)
DDR4-3200CL14122Peak 176 W, then PL1 takes effect - Ryzen 5 5600G
DDR4-3200CL14123 - Ryzen 3 3100
DDR4-3200CL14123 - Ryzen 5 5600X
DDR4-3200CL14124 - Ryzen 5 3400G
DDR4-3200CL14124 - Core i5-12500 (65/117 W)
DDR4-3200CL14124Peak 189W, then PL1 takes effect - Core i7-11700 (65/224 W)
DDR4-2933CL14125Peak 295 W, then PL1 takes effect - Core i5-9400F
DDR4-2666CL14125 - Ryzen 7 5700X
DDR4-3200CL14126 - Core i5-12400 (65/117 W)
DDR4-3200CL14127Peak 171W , then PL1 - Core i5-8400
DDR4-2666CL14130 - Core i9-9980HK (65/95 W)
Intel Whitebook131 - Core i3-12100F
DDR4-3200CL14135 - Ryzen 3 3300X
DDR4-3200CL14136 - Ryzen 7 2700
DDR4-2933CL14137 - Ryzen 7 5700G
DDR4-3200CL14141 - Core i9-9900K (95/119 W)
DDR4-2666CL14144clock reduced to 3.8-3.9 GHz - Core i5-12400
DDR4- 3200CL14147 - Ryzen 5 2600
DDR4-2933CL14149 - Ryzen 7 3700X
DDR4-3200CL14151 - Ryzen 5 3600
DDR4-3200CL14151 - Core i7-7700K
DDR4-2400CL14155 - Ryzen 5 1600X
DDR4-2666CL14157 - Core i5-10400F
DDR4-2666CL14157 - Core i5-12500
DDR4 -3200CL14164 - Ryzen 9 7900 (88W)
DDR5-5200CL32170 - Ryzen 7 7700 (88W)
DDR5-5200CL32170 - Ryzen 5 7600 (88W)
DDR5-5200CL32170,0 - Core i7- 8700K
DDR4-2666CL14174 - Ryzen 5 3600X
DDR4-3200CL14175 - Core i9-9900KS (127/159 W)
DDR4-2666CL14185 clock lowered to 4.1 GHz - Ryzen 5 2600X
DDR4-2933CL14186 - Ryzen 9 5950X
DDR4-3200CL14189lower than everyday, too fast at 100% TDC limit - Core i5 -10600K
DDR4-2933CL14189 - Core i7-11700K (125/250 W)
DDR4-2933CL14191Peak 323 W, then PL1 takes effect - Core i5-10600K (125/182 W)
DDR4-2933CL14191< /li> - Core i5-11600K (125/250 LT)
DDR4-3200CL14193Peak 253 W, then PL1 takes effect - Core i5-12600K (125/150 W)
DDR4-3200CL14195Peak 217W, then PL1 takes effect - Core i7-12700K (125/190W)
DDR4-3200CL14197Peak 276 W, then PL1 takes effect - Ryzen 7 1800X
DDR4-2666CL14198 - Core i9 -11900K (125/250 W)
DDR4-3200CL14198Peak 334 W, then PL1 attacks - Ryzen 9 3900X
DDR4-3200CL14199 - Core i9-12900K (125/241 W)
DDR4-3200CL14200Peak 339 W, then PL1 takes effect - Ryzen 9 5900X
DDR4-3200CL14204lower than everyday, too fast at 100% TDC limit - Ryzen 7 2700X
DDR4-2933CL14206 - Ryzen 7 5800X
DDR4-3200CL14208 - Ryzen 7 3800X
DDR4-3200CL14211 - Ryzen 9 3950X
DDR4-3200CL14219 - Core i5-12600K (150W)
DDR4-3200CL14220 - Core i5-12600K
DDR4-3200CL14229 - Ryzen 7 7700X (142W)
DDR5-5200CL32240 - Core i9-10980XE< br>DDR4-2933CL14240 with AVX offset at 2.3 GHz
- Core i5-11400F
DDR4-2933CL14252 - Core i5-11600K
DDR4-3200CL14253 - Core i7-9800X
DDR4-2400CL14255with AVX offset at 3.4 GHz - Core i9-9900X
DDR4-2400CL14258 with AVX offset at 3.1 GHz - Core i9-7960X
DDR4-2400CL14259 with AVX offset at 2.5-2.6GHz - Core i9-7980XE
DDR4-2400CL14262 with AVX offset at 2.4-2.5 GHz - Core i7-12700K (190W)
DDR4-3200CL14275 - Core i9-9900K
DDR4-2666CL14281 - Core i5-13600K (181 W)
DDR5-5600CL36282 - Ryzen Threadripper 2950X
DDR4-2933CL14291 - Core i7-10700K
DDR4-2666CL14293 - Ryzen Threadripper 2920X
DDR4-2933CL14295 - Core i7-11700 (2933G1)
DDR4-2933CL14297 - Core i7-12700K< br>DDR5-4800CL32303
- Core i7-9700
DDR4-2666CL14315on four boards identically much too high - Core i9-12900K (241 W)
DDR5- 4400CL26342 - Core i9-10900K (125/250 W)
DDR4-2933CL14343 - Core i9-12900K (241W)
DDR4-3200CL14346 - Core i9- 12900K without E-Cores
DDR4-3200CL14355 - Core i7-11700K
DDR4-2933CL14355 - Core i9-12900KS (241 W)
DDR5-4400CL26376 - Core i9-10900K
DDR4-2933CL14376 - Core i7-13700K (253 W)
DDR5-5600CL38380 - Core i9 -12900KS (open, UV)
DDR5-4400CL26, -0.125 Volt381 - Core i9-9900KS
DDR4- 2666CL14386 - Core i9-12900K
DDR4-3200CL14396 - Ryzen Threadripper 3990X
DDR4-3200CL14398Limited by 215 A TDC - Core i9-13900K (253 W)
DDR5-5600CL38398 - Core i9-12900
DDR5-4400CL26403 - Ryzen Threadripper 2970WX
DDR4-2933CL14421 - Ryzen Threadripper 2990WX
DDR4-2933CL14423 - Ryzen Threadripper 3970X
DDR4-3200CL14423 - Ryzen Threadripper 3960X
DDR4-3200CL14429 - Core i9-13900KS (open)
DDR5 -5600CL38535
takes effect
< li class="chart__row">Ryzen 7 5800X3D
DDR4-3200CL14194
< li class="chart__row chart__row--hidden toggle-body-item nojs-tr">Core i9-9980XE
DDR4-2400CL14252
< li class="chart__row">Ryzen 9 7950X (230 W)
DDR5-5200CL32320310 W after TDC limit
< li class="chart__row">Core i9-10850K
DDR4-2933CL14358
li>
li>
< li class="chart__row">Core i9-13900K (open)
DDR5-5600CL38465
Unit: Watt (W) 83 entries Power consumption – full load (CPU Package Power)
- Prime95 29.8 (Small FFTs max power/heat):
- Athlon 200GE
DDR4-2666CL1419 - Athlon 240GE
DDR4-2666CL1426 - Athlon 3000G
DDR4-2666CL1430 - Ryzen 3 2200G
DDR4-2933CL1447 - Ryzen 3 3200G
DDR4-3200CL1455 - Core i3-12100F (58/89 W)
DDR4-3200CL1458Peak 73 W, then PL1 takes effect - Ryzen 3 4350G Pro
DDR4-3200CL1461 - Ryzen 5 3400G
DDR4-3200CL1461 - Ryzen 5 2400G
DDR4-2933CL1462 - Core i7-10710U
Intel NUC63 - Ryzen 3 3100
DDR4-3200CL1464 - Core i5-10400F (65/134 W)
DDR4-2666CL1465clock reduced to 3.3 GHz - Core i7-11700 (65/224 W)
DDR4-2933CL1465Peak 219 W, then PL1 takes action - Core i7-9700 (65/81 W)
DDR4-2666CL1465clock reduced to 2.9-3.0 GHz - Core i9-11900KB (65/109 W)
DDR4-3200CL1465Peak 109 W, then PL1 takes effect - Core i3-10100F (65/90 W)
DDR4-2666CL1465Peak 85 W, then PL1 takes effect - Core i5-12500 (65/117 W)
DDR4-3200CL1465Peak 111 W, then PL1 takes effect - Core i5-11400F (65/154 W)
DDR4-2933CL1465Peak 153 W, then PL1 takes effect - Core i5-12400 (65/117 W)
DDR4-3200CL1465Peak 99 W, then PL1 attacks - Ryzen 5 5500< br>DDR4-3200CL1468
- Ryzen 5 5600G
DDR4-3200CL1473 - Core i3-12100F
DDR4-3200CL1473 - Ryzen 3 3300X< br>DDR4-3200CL1474
- Ryzen 7 5700X
DDR4-3200CL1476 - Ryzen 5 5600X
DDR4-3200CL1476 - Ryzen 7 2700
DDR4-2933CL1476 - Core i3-9100F
DDR4-2666CL1478 - Core i5-12400
DDR4-3200CL1480 - Core i5-9400F
DDR4-2666CL1486 - Ryzen 5 2600
DDR4-2933CL1486 - Ryzen 7 5700G
DDR4-3200CL1488 - Core i5-8400
DDR4-2666CL1489 - Ryzen 5 1600X
DDR4-2666CL1490 - Ryzen 5 3600
DDR4-3200CL1490 - Ryzen 7 3700X
DDR4-3200CL1490 - Ryzen 9 7900 (88W)
DDR5-5200CL3290 - Ryzen 7 7700 (88W)
DDR5-5200CL3290 - Ryzen 5 7600 (88W)
DDR5-5200CL3290 - Core i5-12500
DDR4-3200CL1492 - Core i9-9980HK (65/95 W)
Intel Whitebook95 - Core i9-9900K (95/119 W)
DDR4-2666CL1495clock to 3.8-3.9 GHz lowered - Core i5-10400F
DDR4-2666CL14108 - Core i7-7700K
DDR4-2400CL14109 - Ryzen 5 3600X
DDR4-3200CL14115 - Ryzen 9 5950X
DDR4-3200CL14116EDC reached earlier from 140 A - Core i7-11800H (120W)
XMG Neo 15119 - Ryzen 7 1800X
DDR4-2666CL14119 - Ryzen 5 2600X
DDR4-2933CL14121 - Core i5-11600K (125/250LT)
DDR4-3200CL14125Peak 182 W, then PL1 takes effect - Core i7-11700K (125/250 W)
DDR4-2933CL14125Peak 243 W, then PL1 attacks - Core i5-10600K (125/182 W)
DDR4-2933CL14125 clock at 4.2 GHz lowered - Core i5-12600K (125/150 W)
DDR4-3200CL14125Peak 145 W, then PL1 takes effect - Core i9-12900K (125/241 W)
DDR4-3200CL14125Peak 233 W, then PL1 takes effect - Core i9-11900K (125/250 W)
DDR4-3200CL14125Peak 243 W, then PL1 takes effect - Core i9-10900K (125/250 W)
DDR4-2933CL14125clock lowered to 4 GHz - Core i7-12700K (125/190W)
DDR4-3200CL14125Peak 190 W, then PL1 takes effect - Core i9-9900KS ( 127/159 W)
DDR4-2666CL14127clock reduced to 4.1 GHz - Ryzen 9 5900X
DDR4-3200CL14130EDC of 140 A reached earlier - Ryzen 9 3900X
DDR4-3200CL14131 - Core i7-8700K
DDR4-2666CL14131 - Ryzen 7 5800X3D
DDR4-3200CL14133 - Ryzen 7 2700X
DDR4-2933CL14136 - Ryzen 7 3800X
DDR4-3200CL14141 - Ryzen 7 7700X (142W)
DDR5-5200CL32142 - Core i5-12600K (150W)
DDR4-3200CL14145 - Ryzen 9 3950X
DDR4-3200CL14145 - Core i5-12600K
DDR4- 3200CL14149 - Core i5-10600K
DDR4-2933CL14152 - Core i9-10980XE
DDR4-2933CL14157 with AVX offset at 2.3 GHz - Core i9-9980XE
DDR4-2400CL14158 with AVX offset at 2.4 GHz - Core i7-9800X
DDR4-2400CL14164 with AVX offset at 3 .4GHz - Core i9-7960X
DDR4-2400CL14165with AVX offset at 2.5-2.6GHz< /li> - Core i9-7980XE
DDR4-2400CL14165 with AVX offset at 2.4-2.5GHz
< li class="chart__row chart__row--hidden toggle-body-item nojs-tr">Core i9-9900X
DDR4-2400CL14166 with AVX offset at 3.1 GHz - Athlon 200GE
- Core i5-11400F
DDR4-2933CL14171 - Ryzen Threadripper 2920X
DDR4-2933CL14179 - Ryzen Threadripper 2950X
DDR4-2933CL14179 - Core i5-11600K
DDR4-3200CL14183 - Core i7-12700K (190W)
DDR4-3200CL14190 - Ryzen 9 7950X (230 W)
DDR5-5200CL32196195 W after TDC limit - Core i9-9900K
DDR4-2666CL14211 - Core i7-12700K
DDR5-4800CL32213 - Core i7-10700K
DDR4-2666CL14216 - Core i7-9700
DDR4-2666CL14217on four boards identically much too high - Core i7-11700 (2933G1)
DDR4-2933CL14224 - Core i7-13700K (253 W)
DDR5-5600CL38238< /li> - Core i9-12900K (241 W)
DDR5-4400CL26241 - Core i9-12900KS (241 W)
DDR5- 4400CL26241 - Core i9-12900K (241W)
DDR4-3200CL14242 - Ryzen Threadripper 2990WX
DDR4-2933CL14249 - Ryzen Threadripper 2970WX
DDR4-2933CL14249< /li> - Core i9-13900K (253W)
DDR5-5600CL38253 - Ryzen Threadripper 3990X
DDR4-3200CL14253TDC of 215 A is reached earlier - Core i9-12900
DDR5-4400CL26268 - Core i9-12900KS (open, UV)
DDR5-4400CL26, -0.125 Volt273 - Core i9 -12900K without E-Cores
DDR4-3200CL14274 - Core i7-11700K
DDR4-2933CL14275 - Core i9-9900KS
DDR4-2666CL14275 - Core i9-10850K
DDR4 -2933CL14280 - Core i9-12900K
DDR4-3200CL14285 - Ryzen Threadripper 3970X
DDR4-3200CL14287 - Ryzen Threadripper 3960X
DDR4 -3200CL14287 - Core i9-10900K
DDR4-2933CL14311 - Core i9-13900K (open)< br>DDR5-5600CL38315
- Core i9-13900KS (open)
DDR5-5600CL38347
< li class="chart__row">Core i5-13600K (181 W)
DDR5-5600CL36172
< /ul> Unit: Watt (W) 85 entries Power consumption – full load (PC)
- Cinebench R20 Multi -Core:
- Athlon 200GE
DDR4-2666CL1456 - Athlon 240GE
DDR4-2666CL1461 - Athlon 3000G
DDR4-2666CL1467 - Ryzen 3 2200G
DDR4-2933CL1488 - Core i3-9100F
DDR4-2666CL1488 - Core i5-8400
DDR4-2666CL1492 - Core i5-9400F
DDR4-2666CL1493 - Ryzen 3 4350G Pro
DDR4-3200CL1497 - Ryzen 3 3200G
DDR4-3200CL1497 - Core i3-10100F (65/90W)
DDR4-2666CL1498 - Ryzen 5 4650G Pro
DDR4-3200CL14102 - Core i7-10710U
Intel NUC103 - Ryzen 3 3100
DDR4-3200CL14105 - Core i5-11400F (65/154 W)
DDR4-2933CL14111Peak 188 W, then PL1 takes effect - Core i7-9700 (65/81 W)
DDR4-2666CL14112 - Core i3-12100F
DDR4-3200CL14112 - Core i3-12100F (58 /89 W)
DDR4-3200CL14114 - Ryzen 5 2400G
DDR4-2933CL14115 - Ryzen 5 3400G
DDR4-3200CL14117 - Core i7-7700K
DDR4-2400CL14118 - Ryzen 5 5500
DDR4-3200CL14119 - Core i9-11900KB (65/109 W)
DDR4-3200CL14122Peak 176 W, then PL1 takes effect - Ryzen 7 5700X
DDR4-3200CL14124 - Ryzen 5 5600G
DDR4-3200CL14124 - Core i5-12500 (65/117 W)
DDR4-3200CL14124Peak 157 W, then PL1 attacks - Ryzen 3 3300X
DDR4-3200CL14125 - Core i7-11700 (65/224 W)< br>DDR4-2933CL14125Peak 232, then PL1 takes effect
- Core i5-12400 (65/117 W)
DDR4-3200CL14125Peak 143 W , then PL1 - Core i5-10400F (65/134 W)
DDR4-2666CL14127 - Ryzen 7 4750G Pro
DDR4-3200CL14128 - Ryzen 7 2700
DDR4-2933CL14129 - Core i7-8700K
DDR4-2666CL14131 - Core i5-10400F
DDR4-2666CL14132 - Ryzen 5 3600
DDR4-3200CL14133 - Ryzen 5 5600X
DDR4-3200CL14136 - Core i9-12900 (65/202 W)
DDR5-4400CL26137Peak 312 W, then PL1 takes effect - Core i5-12400
DDR4-3200CL14137 - Ryzen 7 5700G
DDR4-3200CL14140 - Ryzen 5 2600
DDR4-2933CL14140 - Core i9-9900K (95/119 W)
DDR4-2666CL14145 - Core i5-12500
DDR4-3200CL14148 - Core i9-9980HK (65/95 W)
Intel Whitebook149 - Ryzen 5 1600X
DDR4-2666CL14152 - Ryzen 7 3700X
DDR4-3200CL14153 - Core i5-10600K (125/182W)
DDR4-2933CL14159 - Core i5-10600K
DDR4-2933CL14164 - Ryzen 7 7700 (88W)
DDR5-5200CL32170 - Ryzen 5 7600 (88W)
DDR5-5200CL32170 - Ryzen 9 7900 (88W)
DDR5-5200CL32171 - Ryzen 5 2600X
DDR4-2933CL14172
li>
< li class="chart__row">Ryzen 7 5800X3D
DDR4-3200CL14173 - Athlon 200GE
- Ryzen 7 1800X
DDR4-2666CL14176 - Core i7-11700K (125/250 W)
DDR4-2933CL14185Peak 269, then PL1 takes effect - Core i7 -9700
DDR4-2666CL14187 - Core i9-9900KS (127/159 W)
DDR4-2666CL14191 - Core i5-12600K (125/150 W)
DDR4-3200CL14193 - Ryzen 7 3800X
DDR4-3200CL14195 - Core i5-12600K (150 W )
DDR4-3200CL14195 - Core i5-11400F
DDR4-2933CL14197 - Ryzen 9 5950X
DDR4-3200CL14199 - Ryzen 7 5800X
DDR4-3200CL14199 - Ryzen 7 2700X
DDR4-2933CL14199 - Core i5-11600K
DDR4-3200CL14199 - Core i5-11600K (125/250 LT)
DDR4-3200CL14200 - Core i5-12600K
DDR4-3200CL14205 - Ryzen 9 3950X
DDR4-3200CL14211 - Core i9-9900K
DDR4-2666CL14211 - Ryzen 9 5900X
DDR4 -3200CL14213 - Ryzen 9 3900X
DDR4-3200CL14216 - Core i7-10700K
DDR4-2666CL14221 - Core i7-9800X
DDR4-2400CL14223 - Ryzen 7 7700X (142W)
DDR5-5200CL32226 - Core i9-10980XE< br>DDR4-2933CL14229
- Core i7-11700 (2933G1)
DDR4-2933CL14232 - Core i9-9980XE
DDR4-2400CL14238 - Core i9-9900X
DDR4-2400CL14240 - Core i9-7960X
DDR4-2400CL14240 - Core i7-12700K (125/190W)
DDR4-3200CL14251 - Core i9-7980XE
DDR4-2400CL14253 - Core i7-12700K (190W)
DDR4-3200CL14255 - Core i5-13600K (181W)
DDR5-5600CL36257 - Ryzen Threadripper 2950X
DDR4-2933CL14263 - Core i7-12700K
DDR5- 4800CL32266 - Ryzen Threadripper 2920X
DDR4-2933CL14267 - Core i7-11700K
DDR4-2933CL14267 - Core i9-10850K
DDR4-2933CL14273 - Core i9-10900K (125/250 W)
DDR4-2933CL14283 - Core i9-9900KS
DDR4-2666CL14285 - Core i9-11900K (125 /250 W)
DDR4-3200CL14287 - Core i9-10900K
DDR4-2933CL14287 - Core i9-12900
DDR5-4400CL26328 - Ryzen 9 7950X (230W)
DDR5-5200CL32329 - Core i9-12900KS ( open, UV)
DDR5-4400CL26, -0.125 Volt329 - Core i9-12900K
DDR4-3200CL14338 - Core i9-12900K (241W)
DDR4-3200CL14339 - Core i9-12900K without E-Cores
DDR4-3200CL14341 - Core i9-12900K (241 W)
DDR5-4400CL26342 - Core i9-12900K (125/241 W)
DDR4-3200CL14342 - Core i7-13700K (253 W)
DDR5-5600CL38344 - Ryzen Threadripper 2970WX
DDR4-2933CL14382 - Ryzen Threadripper 2990WX
DDR4-2933CL14394 - Core i9-13900K (253 W)< br>DDR5-5600CL38394
- Ryzen Threadripper 3990X
DDR4-3200CL14416 - Ryzen Threadripper 3960X
DDR4-3200CL14418 - Ryzen Threadripper 3970X
DDR4-3200CL14422 - Core i9-13900K (open)
DDR5-5600CL38453 - Core i9-13900KS (open)
DDR5-5600CL38501
li>
li>
< li class="chart__row">Core i9-12900KS (241 W)
DDR5-4400CL26368
Unit: Watt (W) 83 entries Power Consumption – Part Load (PC)
- Cinebench R20 Single-Core:
- Core i7-10710U
Intel NUC39 - Athlon 200GE
DDR4-2666CL1446 - Athlon 240GE
DDR4-2666CL1448 - Athlon 3000G
DDR4-2666CL1450 - Ryzen 3 2200G
DDR4-2933CL1452 - Ryzen 5 5500
DDR4-3200CL1454 - Core i5-8400
DDR4-2666CL1456 - Core i5-9400F
DDR4-2666CL1457 - Ryzen 5 3400G
DDR4-3200CL1459 - Ryzen 3 4350G Pro
DDR4-3200CL1460 - Ryzen 3 3200G
DDR4-3200CL1460 - Core i3-9100F
DDR4-2666CL1460 - Ryzen 7 5700G
DDR4-3200CL1461 - Ryzen 5 2400G
DDR4-2933CL1461 - Core i3-10100F (65/90W)
DDR4-2666CL1462 - Ryzen 5 5600G
DDR4-3200CL1464 - Core i5-10400F
DDR4-2666CL1464 - Core i5-10400F (65/134 W)
DDR4-2666CL1464 - Core i7-7700K
DDR4-2400CL1465 - Core i3-12100F (58/89 W)
DDR4-3200CL1470 - Core i3-12100F
DDR4-3200CL1470 - Ryzen 3 3100
DDR4-3200CL1471 - Core i5-12400
DDR4-3200CL1471
li>
< li class="chart__row chart__row--hidden toggle-body-item nojs-tr">Ryzen 7 5700X
DDR4-3200CL1472 - Core i7-10710U
- Core i9-9900KS
DDR4-2666CL1472 - Core i9-9900KS (127/159 W)
DDR4-2666CL1472 - Core i9-9900K (95/119 W)
DDR4-2666CL1472 - Core i7- 9700
DDR4-2666CL1472 - Core i5-12400 (65/117 W)
DDR4-3200CL1472 - Core i7-8700K
DDR4-2666CL1472 - Ryzen 7 5800X3D
DDR4-3200CL1473 - Ryzen 7 2700
DDR4-2933CL1473 - Ryzen 5 2600
DDR4-2933CL1473 - Core i9-9900K
DDR4-2666CL1474 - Core i5-11400F (65/154 W)
DDR4-2933CL1475 - Ryzen 7 1800X
DDR4-2666CL1476 - Ryzen 5 1600X
DDR4-2666CL1476 - Core i5-12500 (65/117 W)
DDR4-3200CL1476< /li> - Core i9-9980HK (65/95 W)
Intel Whitebook77 - Ryzen 5 5600X
DDR4-3200CL1477 - Core i5-12500
DDR4-3200CL1477 - Ryzen 7 2700X
DDR4-2933CL1479 - Ryzen 5 2600X
DDR4-2933CL1479 - Ryzen 7 5800X
DDR4-3200CL1481 - Ryzen 3 3300X
DDR4-3200CL1481 - Ryzen 5 3600
DDR4-3200CL1482 - Core i9-11900KB (65/109 W)
DDR4 -3200CL1482 - Ryzen 7 3700X
DDR4-3200CL1484 - Core i5-11400F
DDR4-2933CL1484 - Core i5-10600K
DDR4-2933CL1484 - Ryzen 5 3600X
DDR4-3200CL1487 - Core i7-10700K
DDR4-2666CL1490 - Core i5-12600K (125/150 W)
DDR4-3200CL1491 - Core i9-12900K (241W)
DDR4-3200CL1492 - Core i7- 12700K (190W)
DDR4-3200CL1492 - Core i5-12600K (150 W)
DDR4-3200CL1492 - Core i5-11600K (125/250 LT)
DDR4-3200CL1492 - Core i9-12900K (125/241 W)
DDR4-3200CL1493 - Core i5-11600K
DDR4-3200CL1493 - Core i7-12700K (125/190W)
DDR4-3200CL1494 - Core i9-12900K
DDR4-3200CL1495 - Core i9-9980XE
DDR4-2400CL1496 - Ryzen 7 3800X
DDR4-3200CL1497 - Core i9-10900K
DDR4-2933CL1497 - Core i9-10850K
DDR4-2933CL1497 - Core i9-7960X
DDR4-2400CL1497 - Ryzen Threadripper 2920X
DDR4-2933CL1498 - Core i9-10900K (125/250 W)
DDR4-2933CL1498 - Core i5-13600K (181 W)
DDR5-5600CL3698 - Core i7-9800X
DDR4- 2400CL1498 - Ryzen 9 3900X
DDR4-3200CL1499 - Core i9-10980XE
DDR4-2933CL1499 - Core i9-9900X
DDR4-2400CL1499 - Core i9-7980XE
DDR4-2400CL1499 - Ryzen 7 7700X (142W)
DDR5-5200CL32100 - Core i7 -12700K
DDR5-4800CL32100 - Core i7-11700 (65/224 W)
DDR4-2933CL14100 - Ryzen 9 3950X
DDR4-3200CL14101 - Core i9-12900K (241 W)
DDR5-4400CL26101 - Core i7-11700K< br>DDR4-2933CL14101
- Core i7-11700 (2933G1)
DDR4-2933CL14101 - Core i9-12900K without E-Cores
DDR4-3200CL14102 - Core i9-12900 ( 65/202W)
DDR5-4400CL26102 - Ryzen 7 7700 (88W)
DDR5-5200CL32103 - Core i9 -12900
DDR5-4400CL26103 - Ryzen 5 7600 (88W)
DDR5-5200CL32104 - Ryzen Threadripper 2950X
DDR4-2933CL14104 - Ryzen 9 5950X
DDR4-3200CL14105 - Core i7-11700K (125/250 W)
DDR4-2933CL14105 - Ryzen 9 5900X
DDR4-3200CL14106 - Core i9-12900KS (open, UV)
DDR5-4400CL26 , -0.125 volts107 - Core i9-13900KS (open)
DDR5-5600CL38110 - Core i9-13900K (open)
DDR5-5600CL38111 - Core i9-13900K (253 W)
DDR5-5600CL38111 - Core i9-11900K (125/250 W)
DDR4-3200CL14114 - Ryzen 9 7900 (88 W)
DDR5-5200CL32120 - Core i9-12900KS (241W)
DDR5-4400CL26122 - Ryzen 9 7950X (230W)
DDR5-5200CL32123 - Ryzen Threadripper 2970WX
DDR4-2933CL14137 - Ryzen Threadripper 2990WX
DDR4-2933CL14137 - Ryzen Threadripper 3960X
DDR4-3200CL14169 - Ryzen Threadripper 3970X
DDR4-3200CL14169 - Ryzen Threadripper 3990X
DDR4-3200CL14193
li>
< li class="chart__row">Core i5-12600K
DDR4-3200CL1498
< li class="chart__row">Core i7-13700K (253 W)
DDR5-5600CL38101
Unit: Watt (W) 85 entries Power Consumption – Idle (PC)
- Windows desktop:
- Core i7-10710U
Intel NUC6.5 - Ryzen 7 4750G Pro
DDR4-3200CL1424 - Ryzen 5 4650G Pro
DDR4-3200CL1424 - Core i9-9980HK (65/95 W)
Intel Whitebook34 - Ryzen 5 5500
DDR4-3200CL1436 - Core i3-10100F (65/90 W)
DDR4-2666CL1437 - Ryzen 7 5700G
DDR4-3200CL1438 - Ryzen 5 5600G
DDR4-3200CL1438 - Athlon 3000G
DDR4- 2666CL1438 - Athlon 240GE
DDR4-2666CL1438 - Ryzen 3 2200G
DDR4-2933CL1439 - Athlon 200GE
DDR4-2666CL1439 - Core i7-7700K
DDR4-2400CL1440
< li class="chart__row chart__row--hidden toggle-body-item nojs-tr">Core i3-9100F
DDR4-2666CL1440 - Core i7-10710U
- Ryzen 5 3400G
DDR4-3200CL1441 - Ryzen 5 2400G
DDR4-2933CL1441 - Ryzen 3 3200G
DDR4-3200CL1441 - Core i9-9900KS (127/159 W)
DDR4 -2666CL1441 - Core i9-11900KB (65/109 W)
DDR4-3200CL1442 - Core i9-9900KS
DDR4-2666CL1442 - Core i7-9700
DDR4-2666CL1442 - Core i5-12500
DDR4-3200CL1442< /li> - Core i5-12500 (65/117 W)
DDR4-3200CL1442 - Core i5-9400F
DDR4-2666CL1442 - Core i3-12100F (58/89 W)
DDR4-3200CL1442 - Core i3-12100F
DDR4-3200CL1442 - Core i9-9900K
DDR4-2666CL1443< /li> - Core i9-9900K (95/119 W)
DDR4-2666CL1443 - Core i5-12400
DDR4-3200CL1443 - Core i7-8700K
DDR4-2666CL1443 - Core i5-8400
DDR4-2666CL1443 - Core i9-12900K (125/241 W)
DDR4-3200CL1444 - Core i9-12900K (241W)
DDR4-3200CL1444 - Core i5-12600K (125/150 W)
DDR4-3200CL1444 - Core i5-12400 (65/117 W)
DDR4-3200CL1444 - Ryzen 7 5700X
DDR4-3200CL1445 - Core i9-12900K
DDR4-3200CL1445 - Core i7- 12700K (125/190W)
DDR4-3200CL1445 - Core i7-12700K (190W)
DDR4-3200CL1445 - Core i7-10700K
DDR4-2666CL1445 - Core i5-12600K (150 W)< br>DDR4-3200CL1445
- Core i5-10400F
DDR4-2666CL1445 - Core i5-10400F (65/134 W)
DDR4-2666CL1445 - Ryzen 7 5800X3D
DDR4-3200CL1446 - Ryzen 7 1800X
DDR4-2666CL1446 - Ryzen 5 2600X
DDR4-2933CL1446 - Ryzen 5 1600X
DDR4-2666CL1446 - Core i5-10600K (125/182 W)
DDR4-2933CL1446 - Ryzen 7 5800X
DDR4-3200CL1447 - Core i9-10900K
DDR4-2933CL1447 - Core i9-10900K (125/250 W)
DDR4-2933CL1447 - Core i9-10850K
DDR4-2933CL1447 - Core i5-10600K
DDR4-2933CL1447 - Ryzen 7 2700
DDR4-2933CL1448 - Ryzen 5 2600
DDR4-2933CL1448 - Core i5-11400F (65/154 W)
DDR4-2933CL1448 - Ryzen 3 4350G Pro
DDR4-3200CL1449 - Core i5-11600K
DDR4-3200CL1451 - Ryzen 5 5600X
DDR4-3200CL1452 - Core i9-12900K without E-Cores
DDR4-3200CL1452 - Core i9 -12900
DDR5-4400CL2652 - Core i9-12900 (65/202 W)
DDR5-4400CL2652 - Core i9 -12900K (241W)
DDR5-4400CL2654 - Core i7-12700K
DDR5-4800CL3254 - Core i5-12600K
DDR4-3200CL1454 - Core i5-11400F
DDR4-2933CL1454 - Ryzen 9 5900X
DDR4-3200CL1455 - Ryzen 5 3600
DDR4-3200CL1455 - Ryzen 3 3300X
DDR4-3200CL1455 - Ryzen 3 3100
DDR4-3200CL1455 - Ryzen 9 3950X
DDR4-3200CL1456< /li> - Ryzen 7 3700X
DDR4-3200CL1456 - Core i9-13900K (open)
DDR5-5600CL3856 - Core i9-13900K (253W)
DDR5-5600CL3856 - Core i9-12900KS (241W)
DDR5-4400CL2656 - Core i9-11900K (125/250W)
DDR4-3200CL1456 - Core i7-13700K (253W)
DDR5 -5600CL3856 - Core i5-13600K (181W)
DDR5-5600CL3656 - Ryzen 9 3900X
DDR4-3200CL1457 - Ryzen 7 3800X
DDR4-3200CL1457 - Ryzen 5 3600X
DDR4-3200CL1457 - Core i9-9980XE
DDR4-2400CL1458 - Core i7-9800X
DDR4-2400CL1458 - Core i9-9900X
DDR4-2400CL1458 - Core i9-7960X
DDR4-2400CL1458 - Core i9-7980XE
DDR4-2400CL1459 - Core i9-13900KS (open)
DDR5-5600CL3860 - Ryzen 7 7700X (142 W)
DDR5-5200CL3264 - Core i7-11700K
DDR4-2933CL1465 - Core i7-11700K (125/250W)
DDR4-2933CL1465 - Ryzen 9 7950X (230W)
DDR5-5200CL3266 - Ryzen Threadripper 2920X
DDR4-2933CL1466 - Core i7-11700 (2933G1)
DDR4-2933CL1466 - Core i7-11700 (65/224 W)
DDR4-2933CL1466 - Ryzen Threadripper 2950X
DDR4-2933CL1467 - Core i9-12900KS (open, UV)
DDR5 -4400CL26, -0.125 volts67 - Ryzen 7 7700 (88W)
DDR5-5200CL3270 - Ryzen 5 7600 (88W)
DDR5-5200CL3270 - Ryzen 9 7900 (88W)
DDR5-5200CL3275 - Ryzen Threadripper 2970WX
DDR4-2933CL1478 - Ryzen Threadripper 2990WX
DDR4-2933CL1478 - Ryzen Threadripper 3960X
DDR4-3200CL14110 - Ryzen Threadripper 3970X
DDR4-3200CL14110
li>
li>
< li class="chart__row">Ryzen 9 5950X
DDR4-3200CL1456
< li class="chart__row chart__row--hidden toggle-body-item nojs-tr">Core i9-10980XE
DDR4-2933CL1458
Unit: Watt (W)
In Cinebench R20, the Intel Core i9-13900KS also needs 10 percent more energy directly from the socket in open mode, but with the additional 100 MHz more clock across all cores under high load, it only provides added value that is within the scope of the measurement inaccuracies.< /p>
Temperature
Intel's Core i9 in the K versions has been struggling with the temperatures for several generations, which is also why the manufacturer does not peddle a higher TDP – it simply cannot be cooled under normal circumstances, not even Intel managed this in its own test.< /p> 85 entries CPU temperature (multi-core load)
- Prime95 29.8 (Small FFTs max. Power/Heat):
- Athlon 200GE
DDR4-2666CL1440,0 - Core i5-11400F (65/154 W)
DDR4-2933CL1446.0Peak 74 degrees, then PL1 takes hold - Core i7-11700 (65/224 W)
DDR4-2933CL1447.0Peak 82 degrees, then PL1 takes hold - Core i5-10400F (65/134 W)
DDR4-2666CL1448.0clock reduced to 3.3 GHz - Athlon 240GE
DDR4-2666CL1448,0 - Core i7-9700 (65/81W)
DDR4-2666CL1451.0 clock lowered to 2.9-3.0 GHz - Core i5-11600K (125/250 LT)< br>DDR4-3200CL1451.0Peak 62 degrees, then PL1 takes hold
- Core i9-11900K (125/250 W)
DDR4-3200CL1452.0Peak 79 degrees, then PL1 takes effect - Core i5-12500 (65/117 W)
DDR4- 3200CL1452.0Peak 71 degrees, then PL1 takes hold - Core i3-12100F (58/89 W)
DDR4-3200CL1452.0Peak 61 degrees, then PL1 takes hold - Core i3-10100F (65/90 W)
DDR4-2666CL1453.0Peak 63 degrees, then PL1 takes effect - Ryzen 7 2700
DDR4-2933CL1455,5 - Ryzen 7 5700X
DDR4-3200CL1456.0 - Ryzen 5 5500
DDR4-3200CL1456.0 - Core i5-12400 (65/117 W)
DDR4-3200CL1456.0Peak 71 degrees, then PL1 takes hold - Core i9-9900K (95/119 W)
DDR4-2666CL1457.0 clock lowered to 3.8-3.9 GHz - Athlon 3000G
DDR4-2666CL1457.0 - Ryzen 5 5600G
DDR4-3200CL1460,0 - Core i9-12900K (125/241 W)
DDR4-3200CL1461.0Peak 99 degrees, then PL1 takes hold - Core i5-10400F
DDR4-2666CL1461.0 - Ryzen 3 3200G
DDR4-3200CL1461.5 - Core i9-9900KS (127/159 W)
DDR4-2666CL1462.0clock reduced to 4.1 GHz - Core i7-12700K (125/190W)
DDR4-3200CL1462.0Peak 87 degrees, then PL1 takes effect - Core i5-8400
DDR4-2666CL1463,0 - Core i9-9980XE
DDR4-2400CL1463.0with AVX offset at 2.4GHz - Core i3-12100F
DDR4-3200CL1463.0 - Ryzen 5 2600
DDR4-2933CL1463,5 - Ryzen 9 5950X
DDR4-3200CL1464,0 - Ryzen 5 5600X
DDR4-3200CL1464.0 - Core i9-7980XE
DDR4-2400CL1464.0 with AVX -Offset at 2.4 to 2.5 GHz - Ryzen 5 3400G
DDR4-3200CL1464,5 - Ryzen 3 2200G
DDR4-2933CL1465,0 - Core i7-11700K (125/250 W)
DDR4-2933CL1465.0Peak 92 degrees, then PL1 takes hold - Core i5-9400F
DDR4-2666CL1465.0 - Core i9-7960X
DDR4-2400CL1465.0with AVX offset at 2.5-2.6 GHz - Core i5-12500
DDR4-3200CL1466.0 - Core i5-12400
DDR4-3200CL1466.0 - Core i5-10600K (125/182 W)
DDR4-2933CL1466.0 - Ryzen 9 5900X< br>DDR4-3200CL1468,0
- Ryzen 7 5700G
DDR4-3200CL1468,0 - Core i5-10600K
DDR4-2933CL1468.0 - Ryzen 7 3700X
DDR4-3200CL1469,5 - Ryzen 5 2400G
DDR4-2933CL1469 ,5 - Ryzen 5 2600X
DDR4-2933CL1470,3 - Core i3-9100F
DDR4-2666CL1471.0 - Ryzen 9 3900X
DDR4-3200CL1471,5 - Ryzen 3 4350G Pro
DDR4-3200CL1472.0 - Core i9-10980XE
DDR4 -2933CL1472.0with AVX offset at 2.8GHz - Ryzen 5 7600 (88W)
DDR5-5200CL3273,0 - Core i9- 11900KB (65/109 W)
DDR4-3200CL1474.0Peak 98 degrees, then PL1 takes effect - Core i5-12600K ( 125/150 W)
DDR4-3200CL1474.0Peak 79 degrees, then PL1 takes hold - Core i7-8700K
DDR4-2666CL1475.0 - Ryzen 3 3300X
DDR4-3200CL1478.0 - Core i5-11600K
DDR4-3200CL1479.0 - Ryzen 7 2700X
DDR4-2933CL1480 ,0 - Core i7-9800X
DDR4-2400CL1480.5 with AVX offset at 3.4 GHz - Ryzen 5 3600
DDR4-3200CL1481.0 - Core i5-13600K (181W)
DDR5-5600CL3681.0 - Core i9-9900X
DDR4-2400CL1481.0with AVX offset at 3.1GHz - Core i5-12600K (150W)
DDR4-3200CL1482.0 - Core i5-12600K
DDR4-3200CL1482.0 - Core i5-11400F
DDR4-2933CL1482,0 - Ryzen 5 1600X
DDR4-2666CL1483,3 - Ryzen 9 3950X
DDR4-3200CL1484.0 - Core i7-11800H (120W)
XMG Neo 1584.0 - Ryzen Threadripper 3970X
DDR4-3200CL1485.0 - Core i7-12700K (190W)
DDR4-3200CL1486.0 - Ryzen Threadripper 3960X
DDR4-3200CL1487.0 - Core i9-10900K (125 /250 W)
DDR4-2933CL1487,0 - Ryzen 7 1800X
DDR4-2666CL1487,3 - Ryzen 5 3600X
DDR4-3200CL1487,5 - Ryzen Threadripper 3990X
DDR4-3200CL1489,0 - Ryzen 7 5800X
DDR4-3200CL1490,0 - Ryzen Threadripper 2950X
DDR4-2933CL1490,5 - Ryzen 7 5800X3D
DDR4-3200CL1491.0 - Core i7-10700K< br>DDR4-2666CL1491.0
- Core i7-7700K
DDR4-2400CL1491.0 - Ryzen Threadripper 2990WX
DDR4-2933CL1492.0 - Core i9-10900K
DDR4- 2933CL1492.0 - Core i9-9900K
DDR4-2666CL1492.5 - Core i9-10850K
DDR4-2933CL1493, 0 - Core i7-12700K
DDR5-4800CL3293,0 - Core i7-11700K
DDR4-2933CL1493,0 - Core i7-11700 (2933G1)
DDR4-2933CL1493,0 - Core i7-9700
DDR4-2666CL1493,0identical on four boards much too high - Core i9-9980HK (65/95W)
Intel Whitebook94.0 - Ryzen Threadripper 2920X
DDR4-2933CL1494.0 - Ryzen Threadripper 2970WX
DDR4-2933CL1494.0 - Core i9-13900K (253 W)
DDR5-5600CL3894.0 - Ryzen 9 7950X (230W)
DDR5-5200CL3295,0 - Ryzen 7 3800X
DDR4-3200CL1495.0 - Ryzen 7 7700X (142W)
DDR5-5200CL3296,0 - Ryzen 9 5980HS (80W)
Asus ROG Flow X1396.0 - Ryzen 7 5800H (80W)
XMG Core 1596 ,0 - Core i7-10710U
Intel NUC96,0 - Core i9-12900K (241W)
DDR5-4400CL2696.0 - Core i9-12900KS (open, UV)
DDR5-4400CL26, -0.125 Volt98.0 - Core i9-12900K (241W)
DDR4-3200CL1499.0 - Core i9-9900KS
DDR4-2666CL1499.0 - Core i9-13900KS (open, AiO)
DDR5-5600CL38101 ,0 - Core i9-13900KS (open)
DDR5-5600CL38101.0 - Core i9-13900K (open)
DDR5-5600CL38101.0 - Core i9-12900KS (241 W)
DDR5-4400CL26101,0 - Core i9-12900K without E-Cores
DDR4-3200CL14101,0 - Core i9-12900
DDR5-4400CL26101.0 - Core i7-13700K (253W)
DDR5-5600CL38101 ,0 - Core i9-12900K
DDR4-3200CL14102.0
li>
- Athlon 200GE
Unit: °C
Conclusion
This year, Intel only made the Core i9-13900KS official in a press release one week after CES 2023 at market launch, instead of lifting it onto the big stage from the CEO, and has thus taken the product into account: just a look at the theoretical clock rates -Premium on the K model shows how thin the air was for the 3rd generation of the KS this year.
Fastest gaming CPU, fastest CPU in single – and dual-core loads, with the Ryzen 9 7950X almost on par in multi-core apps – all this reads impressive, but should not hide the fact that there is almost the same performance with the 13900K, which is 150 euros less costs.

Already the i9-12900KS (test) struggled to compete with the 12900K and threw away any claim to efficiency to be faster. With the clock surcharges he was then on the course but also everywhere. In the duel 13900KS to 13900K it's even tighter.
With a maximum of 200 instead of 300 MHz in single/dual-core loads and a maximum of 100 MHz more in multi-core scenarios (100 MHz in games, quickly less under full load in applications due to the temperature) it is only enough for the KS in two of the three Scenarios (single-core apps, games) for a razor-thin victory. In the multi-core test course, the samples of K and KS are on par within the measurement inaccuracy.

Interestingly, this also applies if the K and KS are on a lower TDP level ( 142 watts in the test): The test pattern of the KS therefore does not have a better die (binning) per se than the test pattern of the K.
In the end, the only thing left for the Core i9-13900KS is that it is the first mass-market CPU to reach the 6.0 GHz mark without overclocking because it relies on the highest quality Raptor Lake dies. But only overclockers on the hunt for the last MHz will know how to use it.
/TVB (P-Core) Clock/with Turbo
(E-Core) L2 + L3 Graphics PBP
(TDP/PL1) MTP
(PL2) Price< br>(RCP*) Price
(Retail) i9-13900KS 24 (8P + 16E)/32 3.2/5.4/6.0 GHz 2.4/4.3 GHz 32 + 36 MB UHD 770 150 watts 253 watts $ 699 from 759 euros i9-13900K 24(8P+16E)/32 3.0/5.4/5.8GHz 2.2/4.3GHz 32+36MB UHD 770 125W 253W $589 from €618 i9-13900KF24 (8P + 16E)/32 3.0/5.4/5.8 GHz 2.2/4.3 GHz 32 + 36 MB – 125 watts 253 watts $ 564 from 599 euros i9-12900KS 16 (8P + 8E )/24 3.4/5.2/5.5 GHz 2.4/3.9 GHz 14 + 30 MB UHD 770 150 watts 241 watts $ 739 from 549 euros i9-12900K 16 (8P + 8E)/24 3 .2/5.1/5.2 GHz 2.4/3.9 GHz 14 + 30 MB UHD 770 125 watts 241 watts $ 589 from 479 euros i9-12900KF 16 (8P + 8E)/24 3.2/5 .1/5.2 GHz 2.4/3.9 GHz 14 + 30 MB – 125 watts 241 watts $ 564 from 490 euros i7-13700K 16 (8P + 8E)/24 3.4 /5.3/5.4 GHz 2.5/4.2 GHz 24 + 30 MB UHD 770 125 watts 253 watts $ 409 from 449 euros i7-13700KF16 (8P + 8E)/24 3.4/5.3/5.4 GHz 2.5/4.2 GHz 24 + 30 MB – 125 watts 253 watts $ 384 from 421 euros i7-12700K 12 (8P + 4E )/20 3.6/4.9/5.0 GHz 2.7/3.8 GHz 12 + 25 MB UHD 770 125 watts 190 watts $ 409 from 362 euros i7-12700KF 12 (8P + 4E)/20 3 .6/4.9/5.0 GHz 2.7/3.8 GHz 12 + 25 MB – 125 watts 190 watts $ 384 from 366 euros i5-13600K 14 (6P + 8E)/20 3.5/5.1/– GHz 2.6/3.9 GHz 20 + 24 MB UHD 770 125 watts 181 watts $ 319 from 340 euros i5-13600KF 14 (6P + 8E) /20 3.5/5.1/– GHz 2.6/3.9 GHz 20 + 24 MB – 125 watts 181 watts $ 294 from 317 euros i5-12600K 10 (6P + 4E)/16 3.7/4 .9/– GHz 2.8/3.6 GHz 9.5 + 20 MB UHD 770 125 watts 150 watts $ 289 from 275 euros i5-12600KF 10 (6P + 4E)/16 3.7/4.9/– GHz 2.8/3.6 GHz 9.5 + 20 MB – 125 watts 150 watts $ 264 from 282 euros *) without taxes
ComputerBase became the Core i9 13900KS provided on loan by Intel for testing. The manufacturer did not influence the test report and there was no obligation to publish it. There was no NDA.
This article was interesting, helpful or both? The editors are happy about any support from ComputerBase Pro and disabled ad blockers. More about ads on ComputerBase.