Exactly two months after the first test, the Intel Arc A770 and Arc 750 once again face off against the Radeon RX 6000 and GeForce RTX 3000 in the benchmark duel. The drivers are more up-to-date and the course includes more games. In addition, the platform relies on the 12th generation Core instead of Ryzen 7000.
Table of contents
- Intel Arc with current Drivers tested again
- New benchmarks in the high-end test course
- Gaming benchmarks
- Full HD with and without ray tracing
- WQHD without ray tracing
- Further analysis of the benchmarks
- Plus point VRAM, minus point frame pacing
- The new drivers bring a little more FPS< /li>
- In new games it often looks different at launch
- The problems during the tests
- Hardly any big construction sites, but still many small
- Conclusion
- The performance has increased slightly
- Arc Control Center is still annoying
- The price is still too high
Intel Arc with current drivers in test again
Exactly two months ago, after what felt like infinity, Intel's first discrete graphics cards from the Alchemist generation appeared. However, Arc A770 and Arc A750 did not convince in the test, especially the speed was disappointing. Because even in the best case, the performance of the GeForce RTX 3060 was only achieved, which was certainly not Intel's goal.
The conclusion was not so disappointing everywhere, but the performance of Intel's GPUs is extremely dependent on the selection of the games tested or any driver adjustments – and ComputerBase was the only editorial team in the world to use Ryzen 7000 as a test system. But even with the Core i9 test system, the A770 repeatedly lagged behind the RTX 3060 in gaming technology tests. In this case, the games that were tested on the day of publication could not have been newer.
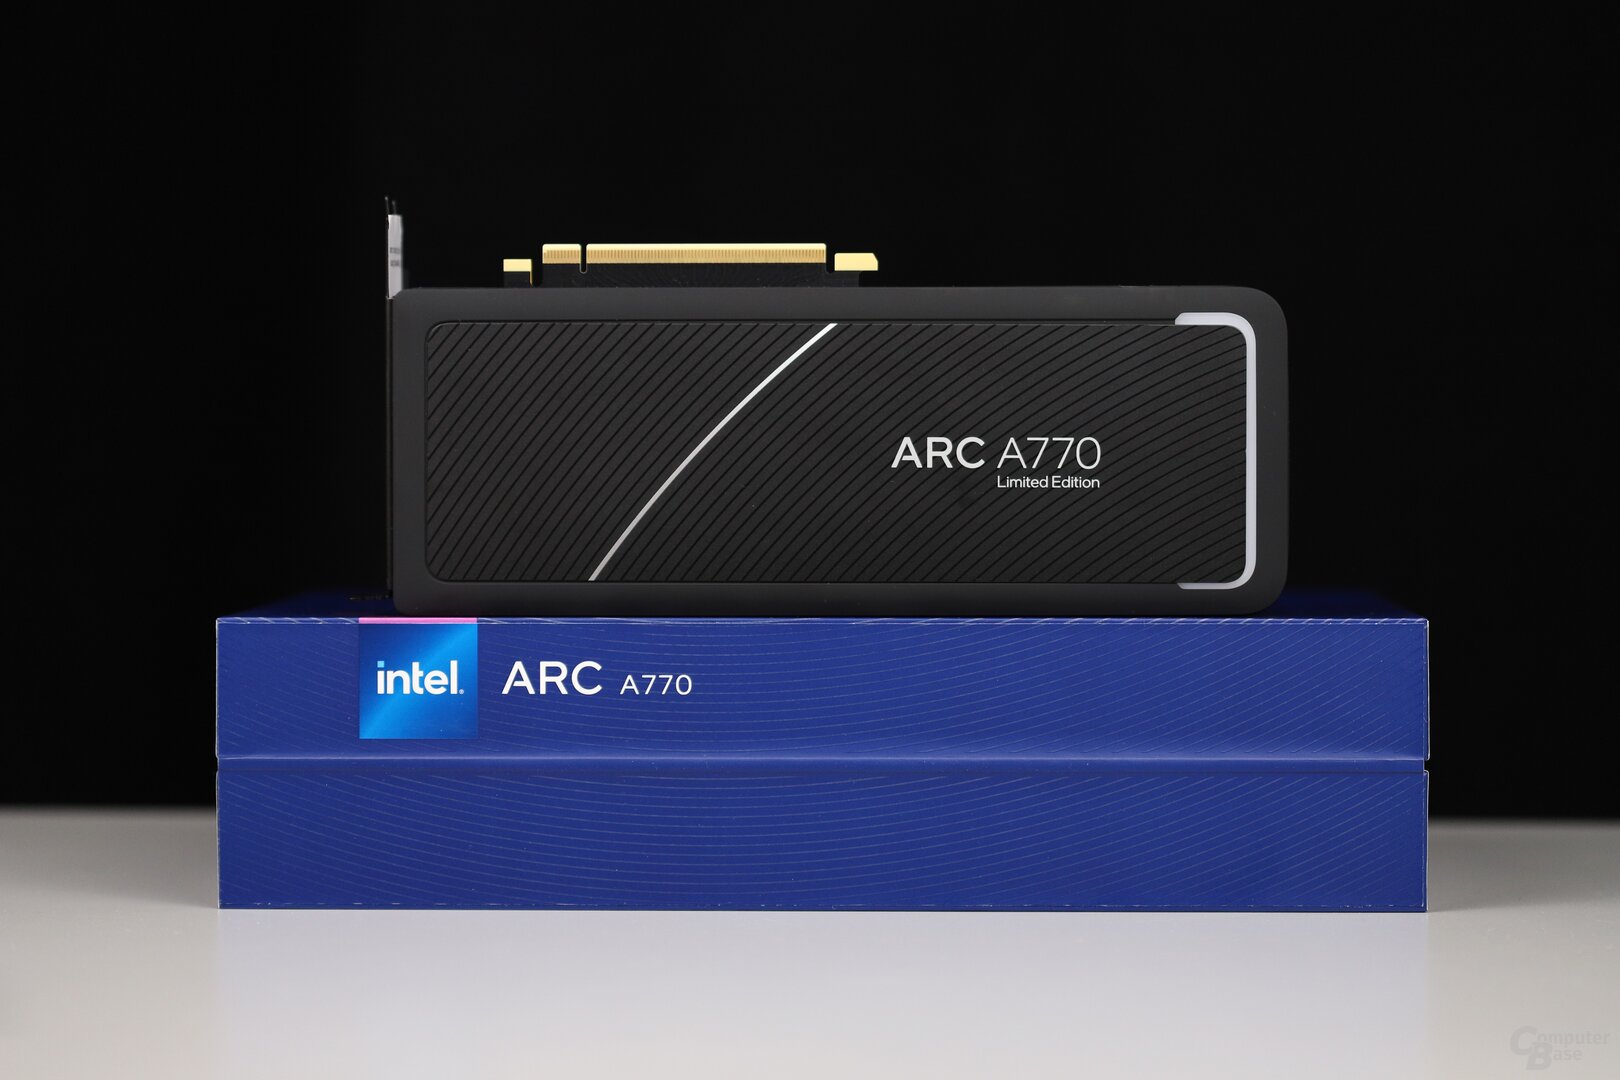 Intel Arc A770 Limited Edition 16GB
 Intel Arc A750 Limited Edition with 8 GB
For the editors, this was reason enough to take a more comprehensive look at the Intel Arc topic – with more Games that have not just been released, the latest drivers and on an established Alder Lake test system.
New benchmarks in the high-end test course
In this case, the full course was used, with which ComputerBase recently examined the GeForce RTX 4090 (test) and the GeForce RTX 4080 (test). The drivers were up to date (Adrenaline 22.11.1, GeForce 526.98, Intel 31.0.101.3802), and the Intel Core i9-12900K was used as the CPU. There won't be much better conditions for the Arc graphics cards.
This test will show whether this has an impact on the benchmarks with the Arc A770 and the Arc A750 in comparison to the AMD Radeon RX 6650 XT, Radeon RX 6700 XT and Nvidia GeForce RTX 3060 as well as GeForce RTX 3060 Ti. It's all about the performance in games with rasterizer and ray tracing graphics in Full HD and WQHD, there are no other test series.
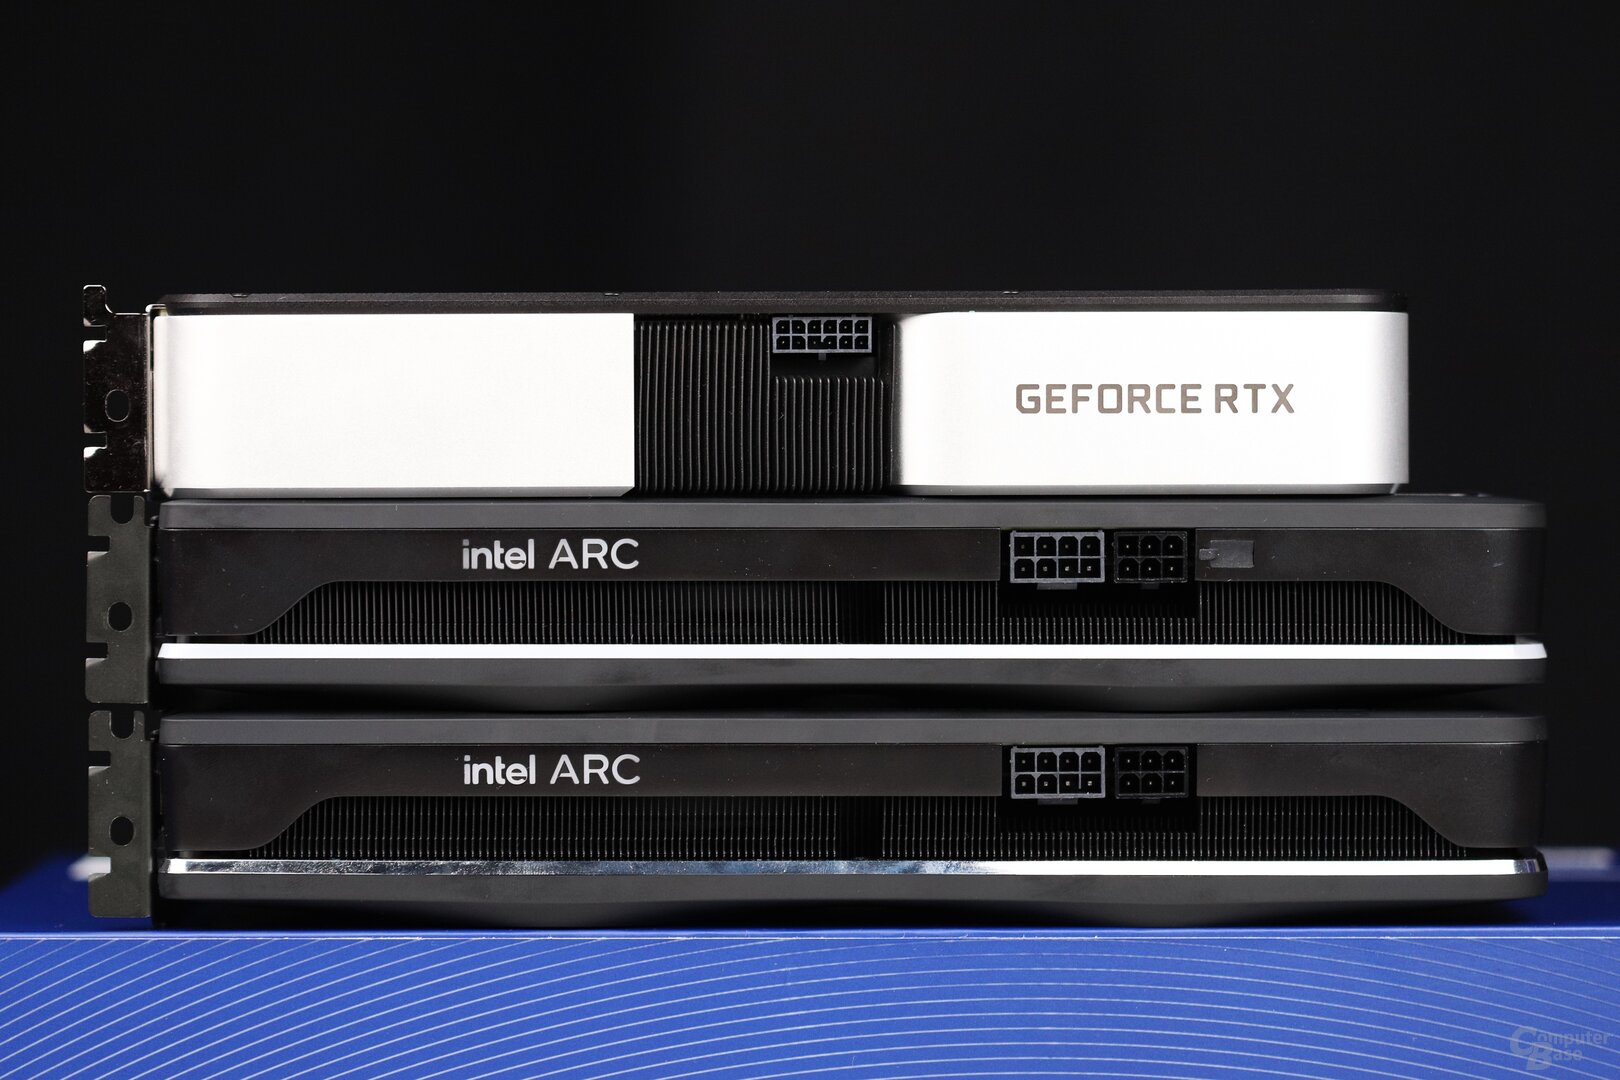 Intel's Limited Edition im Comparison to GeForce RTX 3060 Ti Founders Edition
It is important to remember that the graphics settings used in the games correspond to the new high-end test course and are therefore not designed for an entry-level graphics card. With AMD's RDNA 3 graphics cards Radeon RX 7900 XTX and Radeon RX 7900 XT due to launch, there hasn't been time to customize them.
Gaming Benchmarks
Full HD with and without raytracing
At 1,920×1,080 without ray tracing, the Intel Arc A770 averages the same AVG FPS as the GeForce RTX 3060, while the Radeon RX 6650 XT is 7 percent faster. In terms of percentile FPS, the Intel GPU looks worse; the competition is 8 percent (Nvidia) and 15 percent (AMD) faster here. Both competing models should actually not be on par with the Arc 770 at all. But it's even more evident when the GeForce RTX 3060 Ti and Radeon RX 6700 XT are miles ahead with a 33 percent lead in average FPS and 42 percent in percentile FPS.
With ray tracing, it sometimes looks better for the Arc A770, but sometimes not. The graphics card is then 31 percent faster than the Radeon RX 6650 XT, which suffers from a combination of AMD's well-known RT weakness, the 8 GB VRAM and the PCIe interface halved to 8 lanes. If you compare the performance to the Radeon RX 6700 XT, which still has AMD's RT weakness but no longer the other two, the gap is reduced from 25 and 30 percent to 4 and 8 percent. But the backlog remains.
When compared to the GeForce RTX 3060, the Arc A770 is beaten by 2 and 11 percent, the GeForce RXT 3060 Ti is far ahead. The Arc A770 falls a little further behind the GeForce RTX 3060 with ray tracing than without the rays, but the differences are small.
Without ray tracing, the Arc A750 works 10 and 12 percent slower than the Arc A770 in Full HD, with ray tracing it is 16 and 24 percent slower. The graphics card memory, which has been halved to 8 GB compared to the larger model, has a negative impact here.
Performance rating 1,920 × 1,080
- Rasterizer, AVG FPS
- Rasterizer, Percentile FPS
- Raytracing, AVG FPS
- Raytracing, Percentile FPS
Edit Performance Rating 1,920 × 1,080 – Rasterizer, AVG FPS Inflow Charts All None
- Call of Duty: Vanguard – 1920×1080: FPS, Average
- Cyberpunk 2077 – 1920×1080: FPS, Average
- Deathloop – 1920×1080: FPS, Average
- Doom Eternal – 1920×1080: FPS, Average
- Dying Light 2 – 1920×1080: FPS, Average
- F1 22 – 1920×1080: FPS, Average
- Far Cry 6 – 1920×1080: FPS, Average
- Forza Horizon 5 – 1920×1080: FPS, Average
- Ghostwire Tokyo – 1920×1080: FPS, Average
- God of War – 1920×1080: FPS, Average< /li>
- Guardians of the Galaxy – 1920×1080: FPS, Average
- Halo Infinite – 1920×1080: FPS, Average
- Saints Row – 1920×1080: FPS, Average
- Shadow Warrior 3 – 1920×1080: FPS, Average
- Sniper Elite 5 – 1920×1080: FPS, Average
- Spider-Man Remastered – 1920×1080: FPS, Average
- Tiny Tina's Wonderlands – 1920×1080: FPS, Average
- < li class="chart__group">
- AMD Radeon RX 6700 XT96.0
- Nvidia GeForce RTX 3060 Ti95.9
- AMD Radeon RX 6650 XT77.0
- Nvidia GeForce RTX 306072.2
- Intel Arc A770< /strong>72.0
- Intel Arc A75064.7
Unit: percent Edit Performance Rating 1,920 × 1,080 – Rasterizer, Percentile FPS Inflow Charts All None
- Call of Duty: Vanguard – 1920×1080: FPS, 1% percentile
- Cyberpunk 2077 – 1920×1080: FPS, 1% percentile
- Deathloop – 1920×1080: FPS, 1% percentile
- Doom Eternal – 1920×1080: FPS, 1% percentile
- Dying Light 2 – 1920×1080: FPS, 1% percentile
- F1 22 – 1920 × 1080: FPS, 1% percentile
- Far Cry 6 – 1920 × 1080: FPS, 1% percentile
- Forza Horizon 5 – 1920×1080: FPS, 1% percentile
- Ghostwire Tokyo – 1920×1080: FPS, 1% percentile
- God of War – 1920×1080: FPS, 1% percentile
- Guardians of the Galaxy – 1920×1080: FPS, 1% percentile
- Halo Infinite – 1920×1080: FPS, 1% percentile
- Saints Row – 1920×1080: FPS, 1% percentile
- Shadow Warrior 3 – 1920×1080: FPS, 1% percentile
- Sniper Elite 5 – 1920×1080: FPS, 1% percentile
- Spider-Man Remastered – 1920×1080: FPS, 1st % percentile
- Tiny Tina's Wonderlands – 1920 × 1080: FPS, 1% percentile
li>
-
- AMD Radeon RX 6700 XT92,8
- Nvidia GeForce RTX 3060 Ti92,4
< li class="chart__row">AMD Radeon RX 6650 XT74,9
- Nvidia GeForce RTX 306070,7
- Intel Arc A770 65.2
- Intel Arc A75057.6
Unit: Percent Edit Performance rating 1,920 × 1,080 – Raytracing, AVG-FPS Inflow charts All None
- Cyberpunk 2077 (RT) – 1,920 × 1080: FPS, Average
- Deathloop (RT) – 1920 × 1080: FPS, Average
- Doom Eternal (RT) – 1920 × 1080: FPS, Average
- F1 22 (RT) – 1920×1080: FPS, Average
- Far Cry 6 (RT) – 1920×1080: FPS, Average
- Ghostwire Tokyo (RT) – 1920×1080: FPS, Average
- Guardians of the Galaxy (RT) – 1920 × 1080: FPS, Average
- Metro Exodus Enhanced (RT) – 1920 × 1080: FPS, Average
- Saints Row (RT) – 1920 × 1080: FPS, Average
- Spider-Man Remastered (RT) – 1920×1080: FPS, Average
< li>Dying Light 2 (RT) – 1920×1080: FPS, Average
- < li class="chart__group">
- Nvidia GeForce RTX 3060 Ti95.8
- AMD Radeon RX 6700 XT80.0
- Nvidia GeForce RTX 306078 ,6
- Intel Arc A77077,1
- Intel Arc A75064 ,8
- AMD Radeon RX 6650 XT58,7
Unit: Percent Edit Performance Rating 1,920 × 1,080 – Raytracing, Percentile FPS Inflowing Charts All None
- Cyberpunk 2077 (RT) – 1920×1080: FPS, 1% percentile
- Deathloop (RT) – 1920×1080: FPS, 1% percentile
- Doom Eternal (RT) – 1920 × 1080: FPS, 1% percentile
- Dying Light 2 (RT) – 1920 × 1080: FPS, 1% percentile
- F1 22 (RT) – 1920 × 1080: FPS, 1% percentile
- Far Cry 6 (RT) – 1920×1080: FPS, 1% percentile
- Ghostwire Tokyo (RT) – 1920×1080: FPS, 1% percentile
- Guardians of the Galaxy (RT) – 1920×1080: FPS, 1% percentile
- Metro Exodus Enhanced (RT) – 1920×1080: FPS, 1% percentile
- Saints Row (RT) – 1920×1080: FPS, 1% percentile
- Spider-Man Remastered ( RT) – 1920×1080: FPS, 1% percentile
li>
-
- Nvidia GeForce RTX 3060 Ti92,6
- Nvidia GeForce RTX 306078,2
- AMD Radeon RX 6700 XT76.2
- Intel Arc A77069.8
- AMD Radeon RX 6650 XT53.6
- Intel Arc A75053.0
Unit: percent
A look at the individual games then shows that there is a wild ups and downs with the Arc graphics cards. While GeForce and Radeon accelerators show fairly comparable performance in each game and there are rarely major differences, Intel's are different. Because there are titles in which you can go really fast with Arc.
In Metro Exodus PC Enhanced Edition, for example, the Arc A770 can show off its ray tracing strength and is clearly at the top of the test field. Since GeForce accelerators are not particularly fast in the test scene, the GeForce RTX 3060 Ti is beaten by 7 percent and the Radeon RX 6700 XT by as much as 18 percent. This is the best result. But the Arc A770 is also very fast in Sniper Elite 5 and is just as slightly ahead. The shooter has 3 percent more FPS than AMD and Nvidia GPUs.
And then there are also games in which the Intel GPUs cannot cope at all. In Halo Infinite and Saints Row, the performance is downright catastrophic. While the GeForce RTX 3060 itself achieves almost 60 FPS in Halo Infinite, the Arc A770 only manages 41 FPS and thus achieves values for good playability. The Radeon RX 6650 XT is just 80 percent more powerful, with the percentile FPS even 119 percent. And in Saints Row it's the same. The Arc A770 works with around 46 FPS, while the competition is 80 percent faster. Arc performance is also poor in Cyberpunk 2077 and F1 22, but not quite as bad as in the other two games.
In some titles, the Arc A770 can even clearly set itself apart from the Arc A750 due to the VRAM, which is twice as large at 16 GB. The Arc A770 is 33 percent faster than the smaller model in Cyberpunk 2077 with ray tracing, and 31 percent in Deathloop with RT. A difference of 44 percent can even be measured in Forza Horizon 5 and a whopping 89 percent in Ghostwire: Tokyo with ray tracing, while the difference in most games is less than 10 percent.
1,920 × 1,080
- Call of Duty: Vanguard
- Cyberpunk 2077
- Cyberpunk 2077 (RT)
- Deathloop
- Deathloop (RT)
- Doom Eternal
- Doom Eternal (RT)
- Dying Light 2
- Dying Light 2 (RT)
- F1 22
- F1 22 (RT)
- Far Cry 6
- Far Cry 6 (RT)
- Forza Horizon 5
- Ghostwire Tokyo
- Ghostwire Tokyo (RT)
- God of War
- Guardians of the Galaxy
- Guardians of the Galaxy (RT)
- Halo Infinite
- Metro Exodus Enhanced (RT)
- Saints Row
- Saints Row (RT )
- Shadow Warrior 3
- Sniper Elite 5
- Spider-Man Remastered (RT)
- Tiny Tina's Wonderlands
< li class="chartbundle-tabs__li" role="presentation">Spider-Man Remastered
Call of Duty: Vanguard – 1,920 × 1,080
- FPS, average:
- AMD Radeon RX 6700 XT114.9
- Nvidia GeForce RTX 3060 Ti99,3
- AMD Radeon RX 6650 XT90,8
- Intel Arc A770 83.9
- Nvidia GeForce RTX 306077.1
- Intel Arc A75073.5
- FPS, 1% percentile:
- AMD Radeon RX 6700 XT94,3
- Nvidia GeForce RTX 3060 Ti79, 9
- AMD Radeon RX 6650 XT73.2
- Intel Arc A77065.8
< li class="chart__row">Nvidia GeForce RTX 306057.8
- Intel Arc A75054.4
Unit: frames per second (FPS) Cyberpunk 2077 – 1,920 × 1,080
- FPS, Average:
- Nvidia GeForce RTX 3060 Ti84.5< /li>
- AMD Radeon RX 6700 XT83,7
- Nvidia GeForce RTX 306063,8
- AMD Radeon RX 6650 XT62.0
- Intel Arc A77044.6
- Intel Arc A75039.5
- FPS, 1% percentile:
- Nvidia GeForce RTX 3060 Ti71,2
- Nvidia GeForce RTX 306054.1
- AMD Radeon RX 6700 XT52.5
- AMD Radeon RX 6650 XT42.6
- Intel Arc A77035.2
- Intel Arc A75032.2
Unit: frames per second (FPS) Cyberpunk 2077 (RT) – 1,920 × 1,080
- FPS, average:
- Nvidia GeForce RTX 306023.5
- Nvidia GeForce RTX 3060 Ti23.1
- AMD Radeon RX 6700 XT17.9
- Intel Arc A77017.9
- Intel Arc A75013.5
- AMD Radeon RX 6650 XT10.6
- FPS, 1% percentile:
- Nvidia GeForce RTX 306021.1
- Nvidia GeForce RTX 3060 Ti15.0
- AMD Radeon RX 6700 XT14.4
- Intel Arc A77013.2
- Intel Arc A75010.5
- AMD Radeon RX 6650 XT6.4
Unit: frames per second (FPS) Deathloop – 1920 × 1080
- FPS, Average:
- Nvidia GeForce RTX 3060 Ti98,4
- AMD Radeon RX 6700 XT94,2
- Intel Arc A77085.5
- AMD Radeon RX 6650 XT76.8
- Intel Arc A75073.5
- Nvidia GeForce RTX 306071.5
- FPS, 1% percentile:
- Nvidia GeForce RTX 3060 Ti85,5
- AMD Radeon RX 6700 XT78,3
- Intel Arc A770 74.5
- Nvidia GeForce RTX 306064.5
- AMD Radeon RX 6650 XT58.3
- Intel Arc A75056.2
Unit: Frames per second (FPS) Deathloop (RT) – 1,920 × 1,080
- FPS, average:
- Nvidia GeForce RTX 3060 Ti88.2
- Intel Arc A77070.2
- AMD Radeon RX 6700 XT66.3
- Nvidia GeForce RTX 306065.6
- Intel Arc A75053.7
- AMD Radeon RX 6650 XT46.7
- FPS, 1% percentile:
- Nvidia GeForce RTX 3060 Ti78,6
- Nvidia GeForce RTX 306060,6
- Intel Arc A77059.8
- AMD Radeon RX 6700 XT48.5
- Intel Arc A75040.4
- AMD Radeon RX 6650 XT38.9
Unit: frames per second (FPS) Doom Eternal – 1,920 × 1,080
- FPS, Average:
- AMD Radeon RX 6700 XT245.8
- Nvidia GeForce RTX 3060 Ti224.8
- AMD Radeon RX 6650 XT197.2
- Intel Arc A770191.7
- Nvidia GeForce RTX 3060178.9
- Intel Arc A750172.0
li>
- FPS, 1% percentile :
- AMD Radeon RX 6700 XT187,9
- Nvidia GeForce RTX 3060 Ti166,1
< li class="chart__row">AMD Radeon RX 6650 XT162.0
- Intel Arc A770143.0
- Nvidia GeForce RTX 3060132.4
- Intel Arc A750 131.4
Unit: frames per second (FPS) Doom Eternal (RT) – 1,920 × 1,080
- FPS, Average:
- Intel Arc A770122, 2
- Nvidia GeForce RTX 3060118.4
- AMD Radeon RX 6700 XT111.5
- Intel Arc A750102.6
- Nvidia GeForce RTX 3060 Ti82,8
- AMD Radeon RX 6650 XT82,1
- FPS, 1% percentile:
- Intel Arc A77091.7
< li class="chart__row">Nvidia GeForce RTX 306089.7
- AMD Radeon RX 6700 XT78.7
- Intel Arc A75078.5
- Nvidia GeForce RTX 3060 Ti68.4
- AMD Radeon RX 6650 XT56.1
Unit: frames per second (FPS) Dying Light 2 – 1,920 × 1,080
- FPS, Average:
- AMD Radeon RX 6700 XT97.8< /li>
- Nvidia GeForce RTX 3060 Ti93.8
- Intel Arc A77084.2
- Intel Arc A750 77.3
- AMD Radeon RX 6650 XT75.8
- Nvidia GeForce RTX 306071.2
- FPS, 1% percentile:
- AMD Radeon RX 6700 XT84,6
< li class="chart__row">Nvidia GeForce RTX 3060 Ti79,4
- Intel Arc A77072.5
- AMD Radeon RX 6650 XT66.1
- Intel Arc A75064.4
- Nvidia GeForce RTX 306061.0
Unit: frames per second (FPS) Dying Light 2 ( RT) – 1,920 × 1,080
- FPS, Average:
- Nvidia GeForce RTX 3060 Ti53.2
- Intel Arc A77046.9
- Intel Arc A75043.6
- AMD Radeon RX 6700 XT41.6
- Nvidia GeForce RTX 306040.4
- AMD Radeon RX 6650 XT31 .4
- FPS, 1% percentile:
- Nvidia GeForce RTX 3060 Ti46.6
- Intel Arc A77041.9
- Intel Arc A75038.4
- Nvidia GeForce RTX 306035.7
- AMD Radeon RX 6700 XT35.0
- AMD Radeon RX 6650 XT26.2
Unit: frames per second (FPS ) F1 22 – 1,920 × 1,080
- FPS, Average:
- AMD Radeon RX 6700 XT185.4
- Nvidia GeForce RTX 3060 Ti160.5
- AMD Radeon RX 6650 XT140.9
- Nvidia GeForce RTX 3060123 ,3
- Intel Arc A770100.6
- Intel Arc A75093 .4
- FPS, 1% percentile:
- AMD Radeon RX 6700 XT152,5
- Nvidia GeForce RTX 3060 Ti130,9
- AMD Radeon RX 6650 XT114.5
- Nvidia GeForce RTX 3060102.3
- Intel Arc A77082.6
- Intel Arc A75075.3
unit : Frames per second (FPS) F1 22 (RT) – 1,920 × 1,080
- FPS, average:
- Nvidia GeForce RTX 3060 Ti73.0
- AMD Radeon RX 6700 XT55.4
- Nvidia GeForce RTX 306054.4
- Intel Arc A77045.8
- AMD Radeon RX 6650 XT43.1
- Intel Arc A75042.9
- FPS, 1% percentile:
- < li class="chart__row">Nvidia GeForce RTX 3060 Ti59.6
- Nvidia GeForce RTX 306044.2
- AMD Radeon RX 6700 XT43.6
- Intel Arc A77037.2
- AMD Radeon RX 6650 XT35.1
- Intel Arc A75034.1
Unit: frames per second (FPS) Far Cry 6 – 1,920 × 1,080
- FPS, Average:
- AMD Radeon RX 6700 XT116.7
- Nvidia GeForce RTX 3060 Ti109.1
- AMD Radeon RX 6650 XT95.6
- Intel Arc A77086.2
- Nvidia GeForce RTX 306084.0
- Intel Arc A75079.3
- FPS, 1% percentile:
- AMD Radeon RX 6700 XT98,6
- Nvidia GeForce RTX 3060 Ti91,8
- AMD Radeon RX 6650 XT81,2
- Nvidia GeForce RTX 306072,3
- Intel Arc A77044.7
- Intel Arc A75037.0
Unit: frames per second (FPS) Far Cry 6 (RT) – 1,920 × 1,080
- FPS, Average:
- Nvidia GeForce RTX 3060 Ti87,9
- AMD Radeon RX 6700 XT82,1
- Intel Arc A77070.6
- Nvidia GeForce RTX 306068.1
- Intel Arc A75062.1
- AMD Radeon RX 6650 XT55.6
li>
- FPS, 1% percentile:
- Nvidia GeForce RTX 3060 Ti76.8
- AMD Radeon RX 6700 XT71.9
- Nvidia GeForce RTX 306059.7
- AMD Radeon RX 6650 XT41.8
- Intel Arc A77036.0
- Intel Arc A75020.9
Unit: frames per second (FPS) Forza Horizon 5 – 1,920 × 1,080
- FPS, average:
- AMD Radeon RX 6700 XT80,5
- Nvidia GeForce RTX 3060 Ti78,7
- Intel Arc A77071.9
- Nvidia GeForce RTX 306060.1
- AMD Radeon RX 6650 XT53.3
- Intel Arc A75049.9
li>
- FPS, 1% percentile:
- AMD Radeon RX 6700 XT72,2
- Nvidia GeForce RTX 3060 Ti69,6
- Intel Arc A77063, 2
- Nvidia GeForce RTX 306053.9
- AMD Radeon RX 6650 XT45.2
- Intel Arc A75040.3
Unit: frames per second (FPS) Ghostwire Tokyo – 1,920 × 1,080
- FPS, average:
- AMD Radeon RX 6700 XT134,2
- Nvidia GeForce RTX 3060 Ti127,3
- AMD Radeon RX 6650 XT110.6
- Intel Arc A770106.2
- Intel Arc A75097.8
- Nvidia GeForce RTX 306093.8
- FPS, 1% percentile:
- AMD Radeon RX 6700 XT82.0
- Nvidia GeForce RTX 3060 Ti77.4
- Intel Arc A77065.8
- AMD Radeon RX 6650 XT63.9
- Intel Arc A750 59.1
- Nvidia GeForce RTX 306056.9
Unit: frames per second (FPS) Ghostwire Tokyo (RT) – 1920 × 1080
- FPS, average :
- Nvidia GeForce RTX 3060 Ti63,1
- Intel Arc A77055, 1
- AMD Radeon RX 6700 XT51.8
- Nvidia GeForce RTX 306047.2
- AMD Radeon RX 6650 XT41.6
- Intel Arc A75029.1
- FPS, 1% percentile:
- Nvidia GeForce RTX 3060 Ti39.5
- Intel Arc A770< /strong>33.8
- AMD Radeon RX 6700 XT28.7
- Nvidia GeForce RTX 306026.9
- AMD Radeon RX 6650 XT21.4
- Intel Arc A7509.6
- FPS, average: < ul class="chart__group-body">
- AMD Radeon RX 6700 XT63,3
- Nvidia GeForce RTX 3060 Ti58,1
- Intel Arc A77050.6
- AMD Radeon RX 6650 XT50.5
- Nvidia GeForce RTX 306047.2
- Intel Arc A75045.8
- FPS, 1% percentile:
- AMD Radeon RX 6700 XT50.4
- AMD Radeon RX 6650 XT41.2
- Nvidia GeForce RTX 3060 Ti29.5
- Nvidia GeForce RTX 306028.6
- < strong>Intel Arc A77028.6
- Intel Arc A75028.3
- FPS, average:
- Nvidia GeForce RTX 3060 Ti114,6
- AMD Radeon RX 6700 XT106,3
- Intel Arc A77095.8
- AMD Radeon RX 6650 XT88.4
- Nvidia GeForce RTX 306088.0
- Intel Arc A75087.4
- FPS, 1% percentile:
- Nvidia GeForce RTX 3060 Ti97.0
- AMD Radeon RX 6700 XT78.1
- Nvidia GeForce RTX 306077.0
- AMD Radeon RX 6650 XT69.9
< li class="chart__row">Intel Arc A77052.6
- Intel Arc A75049.4
- FPS , Average:
- Nvidia GeForce RTX 3060 Ti68.9
- Nvidia GeForce RTX 306052.6
- Intel Arc A77050.2
- Intel Arc A75047.1
- AMD Radeon RX 6700 XT43.3
- AMD Radeon RX 6650 XT33.8
- FPS, 1% percentile:
- Nvidia GeForce RTX 3060 Ti60.7
- Nvidia GeForce RTX 306047.3
- AMD Radeon RX 6700 XT36.9
< li class="chart__row">Intel Arc A77032.0
- Intel Arc A75029.8
< /ul>Unit: frames per second (FPS) God of War – 1,920 × 1,080
< /ul>Unit: frames per second (FPS) Guardians of the Galaxy – 1920 × 1080
< /ul>
Unit: frames per second (FPS) Guardians of the Galaxy (RT) – 1920 × 1080
< li class="chart__row">AMD Radeon RX 6650 XT28.7
Unit: frames per second (FPS) Halo Infinite – 1920 × 1080
- FPS, average:
- AMD Radeon RX 6700 XT86,1
- Nvidia GeForce RTX 3060 Ti82,8
- AMD Radeon RX 6650 XT73.0
- Nvidia GeForce RTX 306059.8
- Intel Arc A77040.6
- Intel Arc A75038.5
- FPS, 1% percentile:
- < li class="chart__row">AMD Radeon RX 6700 XT69,1
- Nvidia GeForce RTX 3060 Ti63,7
- AMD Radeon RX 6650 XT61 ,7
- Nvidia GeForce RTX 306048,9
- Intel Arc A77028,2
< li class="chart__row">Intel Arc A75026.2
Unit: frames per second (FPS) Metro Exodus Enhanced (RT) – 1920 × 1080
- FPS, Average:
- Intel Arc A77056.3
- Intel Arc A75052.6
- Nvidia GeForce RTX 3060 Ti52.5
- AMD Radeon RX 6700 XT47.9
- AMD Radeon RX 6650 XT37.6
- Nvidia GeForce RTX 306037.2
- FPS, 1% percentile c :
- Intel Arc A77049.7
- Intel Arc A750 46.7
- AMD Radeon RX 6700 XT44.5
- Nvidia GeForce RTX 3060 Ti40.0
< li class="chart__row">AMD Radeon RX 6650 XT35.0
- Nvidia GeForce RTX 306029.8
Unit: frames per second (FPS) Saints Row – 1,920 × 1,080
- FPS, average:
- Nvidia GeForce RTX 3060 Ti107.2
< li class="chart__row">AMD Radeon RX 6700 XT96,2
- AMD Radeon RX 6650 XT82,8
- Nvidia GeForce RTX 306081, 8
- Intel Arc A77045.6
- Intel Arc A75043.5
- Nvidia GeForce RTX 3060 Ti97.6
- AMD Radeon RX 6700 XT84,6
- AMD Radeon RX 6650 XT74,9
- Nvidia GeForce RTX 306071,4
- Intel Arc A77040.9
- Intel Arc A75038.8
Unit: frames per second (FPS) Saints Row (RT) – 1,920 × 1,080
- FPS, average:
- Nvidia GeForce RTX 3060 Ti95 ,8
- AMD Radeon RX 6700 XT75,1
- Nvidia GeForce RTX 306072,5
- AMD Radeon RX 6650 XT64.2
- Intel Arc A77042.8
- Intel Arc A75041.1
- FPS, 1% percentile:
- Nvidia GeForce RTX 3060 Ti86.4
- AMD Radeon RX 6700 XT66,9
- Nvidia GeForce RTX 306065,8
- AMD Radeon RX 6650 XT56.8
- Intel Arc A77038.4
- Intel Arc A75037.2
Unit: frames per second (FPS) Shadow Warrior 3 – 1,920 × 1,080
- FPS, Average:
- Nvidia GeForce RTX 3060 Ti166.5
- AMD Radeon RX 6700 XT155.2
- AMD Radeon RX 6650 XT124.0< /li>
- Nvidia GeForce RTX 3060121.8
- Intel Arc A770121.6
- Intel Arc A750< /strong>114.1
- FPS, 1% percentile:
- AMD Radeon RX 6700 XT112.3
- Nvidia GeForce RTX 3060 Ti106.1
- AMD Radeon RX 6650 XT90.7
< li class="chart__row">Intel Arc A77086.0
- Nvidia GeForce RTX 306082.8
- Intel Arc A75082.1
Unit: Images per second (FPS) Sniper Elite 5 – 1920 × 1080
- FPS, average:
- Intel Arc A77084.2
- Nvidia GeForce RTX 3060 Ti82.0
- AMD Radeon RX 6700 XT81.5
- Intel Arc A75075.7
- AMD Radeon RX 6650 XT71.3
- Nvidia GeForce RTX 306056.0
- FPS, 1% percentile:
- Nvidia GeForce RTX 3060 Ti70.7
- Intel Arc A77070.5
- AMD Radeon RX 6700 XT66.8
- Intel Arc A75062.6
- AMD Radeon RX 6650 XT57.9
- Nvidia GeForce RTX 306046.5
unit : Frames per second (FPS) Spider-Man Remastered – 1,920 × 1,080
- FPS, average: < ul class="chart__group-body">
- Nvidia GeForce RTX 3060 Ti95,8
- AMD Radeon RX 6700 XT82,6
- Nvidia GeForce RTX 306072.0
- Intel Arc A77069.4
- AMD Radeon RX 6650 XT67.7
- Intel Arc A75062.5
- Nvidia GeForce RTX 3060 Ti81,2
- AMD Radeon RX 6700 XT66,8
< li class="chart__row">Nvidia GeForce RTX 306061.5
Unit: frames per second (FPS) Spider-Man Remastered (RT) – 1,920 × 1,080
- FPS, Average:
- Nvidia GeForce RTX 3060 Ti65.9
- AMD Radeon RX 6700 XT57.0
- Nvidia GeForce RTX 306051.8
- Intel Arc A77049.6
- Intel Arc A75044.5
- AMD Radeon RX 6650 XT36.8
- FPS, 1% percentile:
- Nvidia GeForce RTX 3060 Ti53.9
- AMD Radeon RX 6700 XT47,8
- Nvidia GeForce RTX 306044,4
- Intel Arc A77041.0
- Intel Arc A75036.9
- AMD Radeon RX 6650 XT29.1
Unit: frames per second (FPS) Tiny Tina's Wonderlands – 1,920 × 1,080
- FPS, Average:
- Nvidia GeForce RTX 3060 Ti65.0< /li>
- Intel Arc A77054.5
- AMD Radeon RX 6700 XT53.0
- Intel Arc A75051.2
- Nvidia GeForce RTX 306047.3
- AMD Radeon RX 6650 XT44.4
< /li>
- FPS, 1% percentile:
- Nvidia GeForce RTX 3060 Ti57.7
- Intel Arc A77045.1
- AMD Radeon RX 6700 XT44.0
- Intel Arc A75043.9
- Nvidia GeForce RTX 306041.2
- AMD Radeon RX 6650 XT36.7
Unit: frames per second (FPS)
WQHD without raytracing
In 2,560 × 1,440, the Intel GPUs increase properly. Here the Arc A770 suddenly shows 9 percent more average FPS than the GeForce RTX 3060 and 4 percent more than the Radeon RX 6650 XT, while the percentile FPS are still 4 percent worse than the two competing models. The Arc A770 moves closer to the GeForce RTX 3060 Ti and the Radeon RX 6700 XT accordingly, but the two larger models are still out of reach.
The difference from the Arc A750 to the Arc A770 increases from 11 and 13 percent in Full HD and to 15 and 13 percent in WQHD. Better utilization of the additional computing units in the Arc A770 plays a role here, as does twice the memory.
Performance rating 2,560 × 1,440
- Rasterizer, AVG FPS
- Rasterizer, Percentile FPS
Edit Performance rating 2560 × 1440 – Rasterizer, AVG-FPS Inflow charts All None
- Call of Duty: Vanguard – 2560×1440: FPS, Average
- Cyberpunk 2077 – 2560×1440: FPS, Average
- Deathloop – 2560×1440: FPS, Average
- Doom Eternal – 2560×1440: FPS, Average
- Dying Light 2 – 2560×1440: FPS, Average
- F1 22 – 2560×1440: FPS, Average
- Far Cry 6 – 2560×1440: FPS, Average
- Forza Horizon 5 – 2560×1440: FPS, Average
- Ghostwire Tokyo – 2560×1440: FPS, Average
- God of War – 2560×1440: FPS, Average
- Guardians of the Galaxy – 2560×1440: FPS, Average
- Halo Infinite – 2560×1440: FPS, Average Saints Row – 2560×1440: FPS, Average
- Shadow Warrior 3 – 2560×1440: FPS, Average
- Sniper Elite 5 – 2560×1440: FPS, Average
- Spider-Man Remastered – 2560×1440: FPS, Average
- Tiny Tina's Wonderlands – 2560×1440: FPS, Average
li>
-
- AMD Radeon RX 6700 XT96,8
- Nvidia GeForce RTX 3060 Ti95,7
- Intel Arc A77078,3< /li>
- AMD Radeon RX 6650 XT75,2
- Nvidia GeForce RTX 306072,1
- Intel Arc A75068.2
Unit: Percent Edit Performance Rating 2560 × 1440 – Rasterizer, percentile FPS Inflow charts All None
- Call of Duty: Vanguard – 2560 × 1440: FPS, 1% percentile
- Cyberpunk 2077 – 2560×1440: FPS, 1% percentile
- Deathloop – 2560×1440: FPS, 1% percentile
- Doom Eternal – 2560×1440: FPS, 1st % Percentile
- Dying Light 2 – 2560×1440: FPS, 1% percentile
- F1 22 – 2560×1440: FPS, 1% percentile
- Far Cry 6 – 2560×1440: FPS, 1% percentile
- Forza Horizon 5 – 2560×1440: FPS, 1% percentile
- Ghostwire Tokyo – 2560×1440: FPS, 1st % Percentile
- God of War – 2560×1440: FPS, 1% percentile
- Guardians of the Galaxy – 2560×1440: FPS, 1% percentile
- Halo Infinite – 2560×1440: FPS, 1% percentile
- Saints Row – 2560×1440: FPS, 1% percentile
- Shadow Warrior 3 – 2560×1440: FPS, 1% Percentile
- Sniper Elite 5 – 2560×1440: FPS, 1% percentile
- Spider-Man Remastered – 2560×1440: FPS, 1% percentile
- Tiny Tina's Wonderlands – 2560×1440: FPS, 1% percentile
-
- AMD Radeon RX 6700 XT94.0
- Nvidia GeForce RTX 3060 Ti92,6
- AMD Radeon RX 6650 XT72,2
- Nvidia GeForce RTX 306072.1
- Intel Arc A77069.5
- Intel Arc A75061.4
Unit: percent
The individual games show the same strengths and weaknesses of the two Arc graphics cards in the higher resolution, but the Intel GPUs perform slightly better than in the lower resolution. The massive problems in Halo Infinite and Saints Row remain, with both Arc graphics cards becoming virtually no slower in 2560 × 1440 than in 1920 × 1080.
2560 × 1440
- Call of Duty: Vanguard
- Cyberpunk 2077
- Deathloop
- Doom Eternal
- Dying Light 2
- F1 22
- Far Cry 6
- Forza Horizon 5
- Ghostwire Tokyo
- God of War
- Guardians of the Galaxy
- Halo Infinite
- Saints Row
- Shadow Warrior 3
- Sniper Elite 5
- Spider-Man Remastered
- Tiny Tina's Wonderlands
Call of Duty: Vanguard – 2,560 × 1,440
- FPS, Average:
- AMD Radeon RX 6700 XT77.9
- Nvidia GeForce RTX 3060 Ti66.8
- Intel Arc A77060.9
- AMD Radeon RX 6650 XT60.3
- Nvidia GeForce RTX 306049.7
- Intel Arc A75042.5
li>
- FPS, 1% percentile:
- AMD Radeon RX 6700 XT62,2
- Nvidia GeForce RTX 3060 Ti50,1
- AMD Radeon RX 6650 XT50.0
- Intel Arc A77042.5
- Nvidia GeForce RTX 306037.8
- Intel Arc A75034.7
Unit: frames per second (FPS) Cyberpunk 2077 – 2,560 × 1.440
- FPS, average:
- Nvidia GeForce RTX 3060 Ti50,3
- AMD Radeon RX 6700 XT48.9
- AMD Radeon RX 6650 XT39.8
- Nvidia GeForce RTX 306038.6
- Intel Arc A77033.9
- Intel Arc A75031.7
- FPS, 1% percentile:
- Nvidia GeForce RTX 3060 Ti44.5
- Nvidia GeForce RTX 306033.8< /li>
- AMD Radeon RX 6700 XT33.5
- AMD Radeon RX 6650 XT30.4
- < strong>Intel Arc A77023.4
- Intel Arc A75021.8
- FPS, average:
- Nvidia GeForce RTX 3060 Ti71,7
- AMD Radeon RX 6700 XT67,6
- Intel Arc A77065.6
- AMD Radeon RX 6650 XT53.6
- Intel Arc A75052.3
- Nvidia GeForce RTX 306052.2
- FPS, 1% percentile:
- Nvidia GeForce RTX 3060 Ti65.0
- Intel Arc A770< /strong>55.9
- AMD Radeon RX 6700 XT52.0
- Nvidia GeForce RTX 306048.1
- AMD Radeon RX 6650 XT44.0
- Intel Arc A75042.6
- FPS, average:
- AMD Radeon RX 6700 XT184,2
- Nvidia GeForce RTX 3060 Ti171,7
- Intel Arc A770147.1
- AMD Radeon RX 6650 XT139.6
- Nvidia GeForce RTX 3060137.7
- Intel Arc A75091.3
- FPS, 1% percentile:
- AMD Radeon RX 6700 XT149.4
- Nvidia GeForce RTX 3060 Ti132.6
- AMD Radeon RX 6650 XT117.0
- Intel Arc A770112.1
- Nvidia GeForce RTX 3060111.2
- Intel Arc A75067.2
- FPS, average: < ul class="chart__group-body">
- AMD Radeon RX 6700 XT64,0
- Nvidia GeForce RTX 3060 Ti63,9
- Intel Arc A77059.6
- Intel Arc A75052.9
- AMD Radeon RX 6650 XT48.3
- Nvidia GeForce RTX 306046.7
- FPS, 1% percentile:
- AMD Radeon RX 6700 XT55.2
- Nvidia GeForce RTX 3060 Ti54.7
- Intel Arc A77051.1
- Intel Arc A75044.9
- AMD Radeon RX 6650 XT42.2
- Nvidia GeForce RTX 306041.1
< /ul>
- FPS, average:
- AMD Radeon RX 6700 XT135,9
- Nvidia GeForce RTX 3060 Ti118,4
- AMD Radeon RX 6650 XT102,6
- Nvidia GeForce RTX 306088,8
- Intel Arc A77085.9
- Intel Arc A75077.4
- FPS, 1% percentile:
- AMD Radeon RX 6700 XT114,3
- Nvidia GeForce RTX 3060 Ti97,4
- Nvidia GeForce RTX 306074,6
- Intel Arc A77071.7
- Intel Arc A75062.5
- AMD Radeon RX 6650 XT59.7
- FPS, average: < ul class="chart__group-body">
- AMD Radeon RX 6700 XT82,2
- Nvidia GeForce RTX 3060 Ti80,2
- AMD Radeon RX 6650 XT68.6
- Intel Arc A77066.5
- < strong>Intel Arc A75060.7
- Nvidia GeForce RTX 306060.1
- FPS, 1% percentile:
- AMD Radeon RX 6700 XT68.7
- Nvidia GeForce RTX 3060 Ti68.3
- AMD Radeon RX 6650 XT56.3
< li class="chart__row">Nvidia GeForce RTX 306052.7
- Intel Arc A77025.5
- Intel Arc A75024.9
< /ul>Unit: frames per second (FPS) Deathloop – 2,560 × 1,440
< /ul>Unit: frames per second (FPS) Doom Eternal – 2560 × 1440
< /ul>Unit: frames per second (FPS) Dying Light 2 – 2,560 × 1,440
Unit: frames per second (FPS) F1 22 – 2,560 × 1,440
Unit: frames per second (FPS) Far Cry 6 – 2560 × 1440
Unit: frames per second (FPS) Forza Horizon 5 – 2560 × 1440
- FPS, average: < ul class="chart__group-body">
- AMD Radeon RX 6700 XT56.7
- Intel Arc A77053.3< /li>
- Nvidia GeForce RTX 3060 Ti47,7
- Nvidia GeForce RTX 306042,8
- Intel Arc A75041.1
- AMD Radeon RX 6650 XT31.2
- AMD Radeon RX 6700 XT51.6
- Intel Arc A77048.1
- Nvidia GeForce RTX 3060 Ti41,6
- Nvidia GeForce RTX 306038,4
- Intel Arc A750 32.8
- AMD Radeon RX 6650 XT26.7
Unit: frames per second (FPS) Ghostwire Tokyo – 2,560 × 1,440
- FPS, average:
- AMD Radeon RX 6700 XT82,2
- Nvidia GeForce RTX 3060 Ti81,7
- Intel Arc A77071.6
- Intel Arc A75067.2
- AMD Radeon RX 6650 XT65.2
- Nvidia GeForce RTX 306060.1
- FPS, 1% percentile :
- Nvidia GeForce RTX 3060 Ti48,1
- AMD Radeon RX 6700 XT46,4
< li class="chart__row">Intel Arc A77040.4
- Intel Arc A75037.5
- Nvidia GeForce RTX 306034.5
< li class="chart__row">AMD Radeon RX 6650 XT35.0
Unit: frames per second (FPS) God of War – 2,560 × 1,440
- < li class="chart__group"> FPS, average:
- AMD Radeon RX 6700 XT56.2
- Nvidia GeForce RTX 3060 Ti54.5
- Intel Arc A77045.8
- AMD Radeon RX 6650 XT43.5< /li>
- Intel Arc A75042.0
- Nvidia GeForce RTX 306040.8
- FPS, 1% percentile:
- AMD Radeon RX 6700 XT45.8
- AMD Radeon RX 6650 XT36.2
- Nvidia GeForce RTX 3060 Ti28,9
- Nvidia GeForce RTX 306028,6
- Intel Arc A77028.5
- Intel Arc A75028.4
li>
Unit: frames per second (FPS) Guardians of the Galaxy – 2,560 × 1,440
- FPS, Average:
- Nvidia GeForce RTX 3060 Ti84, 8
- AMD Radeon RX 6700 XT80.2
- Intel Arc A77074.7
< li class="chart__row">Intel Arc A75069.0
- AMD Radeon RX 6650 XT65.0
- Nvidia GeForce RTX 306064.8
- Nvidia GeForce RTX 3060 Ti75.1
- AMD Radeon RX 6700 XT65,3
- Nvidia GeForce RTX 306056,7
- AMD Radeon RX 6650 XT53,1
- Intel Arc A77044.3
- Intel Arc A75043.6
Unit: frames per second (FPS) Halo Infinite – 2,560× 1,440
- FPS, Average:
- AMD Radeon RX 6700 XT67.0
- Nvidia GeForce RTX 3060 Ti60.8
- AMD Radeon RX 6650 XT56.1
- Nvidia GeForce RTX 306044.4
- Intel Arc A77035.3
- Intel Arc A750< /strong>34.2
li>
- FPS, 1% percentile:
- AMD Radeon RX 6700 XT54,7
- Nvidia GeForce RTX 3060 Ti50,4
- AMD Radeon RX 6650 XT47,3
< li class="chart__row">Nvidia GeForce RTX 306039.0
- Intel Arc A77027.6
- Intel Arc A75026.8
Unit: frames per second ( FPS) Saints Row – 2560 × 1440
- FPS, Average:
- Nvidia GeForce RTX 3060 Ti76.5
- AMD Radeon RX 6700 XT71.0
- AMD Radeon RX 6650 XT58.0
- Nvidia GeForce RTX 306056.8
- Intel Arc A77039.4
- Intel Arc A750< /strong>37.2
- FPS, 1% percentile:
- Nvidia GeForce RTX 3060 Ti67,9
- AMD Radeon RX 6700 XT62,9
- AMD Radeon RX 6650 XT52,2
< li class="chart__row">Nvidia GeForce RTX 306048.0
- Intel Arc A77036.3
- Intel Arc A75034.0
- FPS, average:
- Nvidia GeForce RTX 3060 Ti107,4
- AMD Radeon RX 6700 XT99,6
- Intel Arc A77087.1
- Intel Arc A75081.9
- Nvidia GeForce RTX 306079.1
- AMD Radeon RX 6650 XT76,4
- FPS, 1% percentile:
- Nvidia GeForce RTX 3060 Ti74,7
- AMD Radeon RX 6700 XT71,7
- Intel Arc A770 63.0
- Intel Arc A75061.1
- Nvidia GeForce RTX 306058.8
- AMD Radeon RX 6650 XT55.6
unit : Frames per second (FPS) Sniper Elite 5 – 2,560 × 1,440
- FPS, average:
- Intel Arc A77066.2
- AMD Radeon RX 6700 XT65.7
- Nvidia GeForce RTX 3060 Ti62.3
- Intel Arc A75059.8
- AMD Radeon RX 6650 XT53, 8
- Nvidia GeForce RTX 306043.6
- FPS, 1% percentile:
- Intel Arc A77056.6
- AMD Radeon RX 6700 XT55.8
< li class="chart__row">Nvidia GeForce RTX 3060 Ti54,3
- Intel Arc A75051.0
- AMD Radeon RX 6650 XT45.7
- Nvidia GeForce RTX 306036.9
Unit: frames per second (FPS) Spider-Man Remastered – 2,560 × 1,440
- FPS, Average:
- Nvidia GeForce RTX 3060 Ti67.9
- AMD Radeon RX 6700 XT62.3
- Intel Arc A77054.0
- Nvidia GeForce RTX 306053.0
- AMD Radeon RX 6650 XT50.0
- Intel Arc A75049.0
- FPS, 1% percentile:
- Nvidia GeForce RTX 3060 Ti52.6
- AMD Radeon RX 6700 XT52.0
- Nvidia GeForce RTX 306044.6
- Intel Arc A77043.6
- Intel Arc A75040.4
- AMD Radeon RX 6650 XT39.8
Unit: frames per second (FPS) Tiny Tina's Wonderlands – 2,560 × 1,440
- FPS, Average:
- Nvidia GeForce RTX 3060 Ti51.4< /li>
- AMD Radeon RX 6700 XT43.2
- Intel Arc A77042.5
- Intel Arc A750 39.7
- Nvidia GeForce RTX 306037.2
- AMD Radeon RX 6650 XT35.3
- FPS, 1% percentile:
- Nvidia GeForce RTX 3060 Ti45,1
< li class="chart__row">AMD Radeon RX 6700 XT36.0
- Intel Arc A75035.0
- Intel Arc A77034.5
- Nvidia GeForce RTX 306033.1
- AMD Radeon RX 6650 XT29.6
Unit: frames per second (FPS)
Further analysis of benchmarks
If you take a closer look at the measured values, you can find more details. What is interesting is the ray tracing performance, which is on par with Nvidia's Ampere generation and is therefore clearly superior to AMD's RDNA 2. That's hardly surprising, because the RT structure of the Intel accelerators is very similar to that of the Nvidia competition.
This can already be seen from the ratings. The Arc A770 without ray tracing in Full HD is just as fast as the GeForce RTX 3060, while the Radeon RX 6700 XT is 33 percent more powerful. If you are wondering about the strange comparison here: The editors make it because the Radeon RX 6650 XT and the GeForce RTX 3060 Ti, like the Arc A750, suffer from VRAM shortages in places. Arc A770 and RTX 3060, like the RX 6700 XT, have no problem in this regard, which is why comparing these models makes more sense.
With ray tracing, the Radeon RX 6700 XT is suddenly only 4 percent faster than the Radeon RX 6700 XT, so Intel's graphics card has just caught up 29 percentage points to the AMD GPU. Compared to the GeForce RTX 3060, the Arc A770 shows exactly the same performance with pure rasterizer performance, with ray tracing the Intel card is almost 2 percent behind. So Nvidia is only marginally ahead. No system can be recognized in the individual games – sometimes Intel loses more performance, sometimes Nvidia. Depending on the game selection, the differences are quite large. But since there are hardly any on average, it can be said that Intel's ray tracing performance is comparable to that of Nvidia – with minimal advantages for GeForce.
Plus point VRAM, minus point frame pacing
A look at the VRAM management is also interesting. Here, the Arc graphics cards seem to behave very similarly to their counterparts from AMD. If the Radeon RX 6650 XT runs out of 8 GB of VRAM, the same applies to the Arc A750. The AMD graphics card suffers more due to the halved PCIe interface, but the 3D accelerators behave similarly – with perhaps slight advantages for Intel. However, it is also possible that the Arc A750 can occasionally save itself with the larger PCIe interface. On the other hand, Nvidia's memory management is significantly better when there is a lack of VRAM. Both AMD and Intel still have a lot of progress to make here.
 Arc A750 and A770 don't stand a chance against the GeForce RTX 3060 Ti
What still remains are Intel's problems with frame pacing, which still performs significantly worse than on AMD and Nvidia graphics cards. This does not apply consistently to all games, but it is evident in quite a few titles, some of which have a major impact. Far Cry 6 on the Arc A770, for example, is a decent stutter orgy despite 86 AVG FPS, although this is the worst-case scenario. Guardians of the Galaxy also shows big problems with frame pacing, while the situation in other games is not necessarily optimal, but much better.
What has apparently remained the same is that Intel only really gets the execution units fully utilized in higher resolutions. In Full HD, the render pipelines still seem to be full of “bubbles”, otherwise there is no other explanation for the massive leap in performance in WQHD compared to Full HD compared to the Radeon and GeForce graphics cards. From a tie with the GeForce RTX 3060 in Full HD to a lead of 9 percent in WQHD is quite a feat and shows that some of the theoretically available computing power does not make it in Full HD.
The new drivers bring a little more FPS
The direct comparison to the launch article for the Arc A770 and Arc 750 is also interesting. The tests cannot be compared directly with each other, but the Arc graphics cards have apparently made some progress in terms of performance since then. In this test, the Arc A770 in WQHD is 4 percent faster than the Radeon RX 6650 XT, in the article at the time the Radeon was still 4 percent ahead. In Full HD, the Radeon is currently 7 percent ahead, back then it was 16 percent. Of course, the games selected are completely different, but it can't be purely coincidental, especially since the overlapping titles like Cyberpunk 2077 and F1 22 also show progress.
In new games it often looks different at the launch
On the test course, Intel's Arc A770 and Arc A750 performed better than when they were introduced two months ago, but the latest titles weren't represented there either. And there the situation looks more like it was compared to October.
The Arc A770 does best in A Plague Tale: Requiem (test), where at least the performance of a GeForce RTX 3060 and a Radeon RX 6600 XT (not the RX 6650 XT used in the test, which is about 3 percent faster is) is achieved, but nothing more. In Spider-Man: Miles Morales (test), the Arc A770 again roughly reaches the level of the Radeon RX 6600 XT, but the GeForce RTX 3060 is a good deal faster. And in Gotham Knights, the Arc A770 is clearly behind the AMD and Nvidia graphics cards.
In addition, the Intel graphics cards are worse in all three games frame pacing than the competing models. In Spider-Man: Miles Morales, the differences are rather small, but in the other two titles they are significantly larger – and also noticeable.
The problems during the tests
When testing the entry-level solution Arc A380 (test) war Intel's driver quality is still downright catastrophic. There haven't been so many problems of all kinds in the graphics card segment lately. In the meantime, however, the group has made great progress, and its own software works much more reliably than it did a few months ago.
Unlike back then, there were no longer any really big problems. For example, ComputerBase didn't play around with the driver menu much. If you use the Alchemist graphics cards more or less in standard settings and don't experiment much, you will no longer encounter annoying construction sites.
Hardly any major construction sites, but many more small ones
However, there are still a number of minor problems that are not found in the competing products from AMD and Nvidia. The driver menu, for example, is still an annoying overlay that asks for cookies to be confirmed on every boot and always shows the same shortcut hints, no matter how many times you've viewed and dismissed them.
When playing the game itself, relatively long loading times are noticeable in some titles. Deathloop in particular is bad in this regard. It's not without reason that the game annoys you by notifying you that Intel GPUs are not officially supported when you start it. After all, once it's fully loaded, it runs perfectly.
God of War is also worth mentioning. While the game itself runs properly, the menu just stutters, although it actually only renders game graphics – strange. Apart from the miserable performance, Halo Infinite unfortunately has to struggle with graphic errors in some lighting effects. Especially after loading a saved game, some lighting effects outshine the entire image for a few seconds, which then disappears by itself.
Likewise, Saints Row is behaving strangely. The launcher recommends DirectX 11, which is not a good idea on an Arc graphics card. Alchemist's DirectX 12 performance is already poor in Saints Row, but DX11 performance ups the ante on a negative note. As a kind of compensation, the game process does not always close correctly in the DirectX 12 version, only the task manager or restarting the computer helps.
Halo Infinite is also worth mentioning. Not because of the generally low Arc performance in the game, but because of the Arc A750 with the 8GB VRAM. While other graphics cards have no problems with the maximum detail level in Full HD – this also applies to the Radeon RX 6650 XT with the halved PCIe interface – the Arc GPUs with 8 GB are visibly running out of VRAM in the game. There the textures are then missing for half of the objects. In other titles, however, Arc is not as sensitive to memory management.
 Halo Infinite on the Intel Arc A750
And last but not least, the Intel software or the Arc Control Center causes problems again if the Intel driver is not uninstalled and a graphics card from another manufacturer is installed. Because then the Control Center complains loudly during the first restart that no compatible hardware is installed. That shouldn't be the case, but it's not a broken leg. This changes, however, when this notice (like the menu itself) appears as an overlay – with an “Okay” button that simply cannot be pressed. And at the latest when even the task manager only appears behind the overlay, you don't want to install the control center at all. Something like this shouldn't happen.
Conclusion
Intel has made some progress in driver quality for the Arc graphics cards over the past two months, which is reflected in all areas. Performance has improved, the drivers are more stable and the number of problems is generally decreasing. No matter how positive this is, it must not be forgotten what a low level Intel finally came from. And that doesn't mean “better” means “good”.
-
 Intel Arc A770 and Arc A750 as Limited Edition tested
Image 1 of 7
< figure class="text-asset text-width text-asset--with-border-bottom">
 Intel Arc A770 Limited Edition 16GB
 Intel Arc A750 Limited Edition 8GB
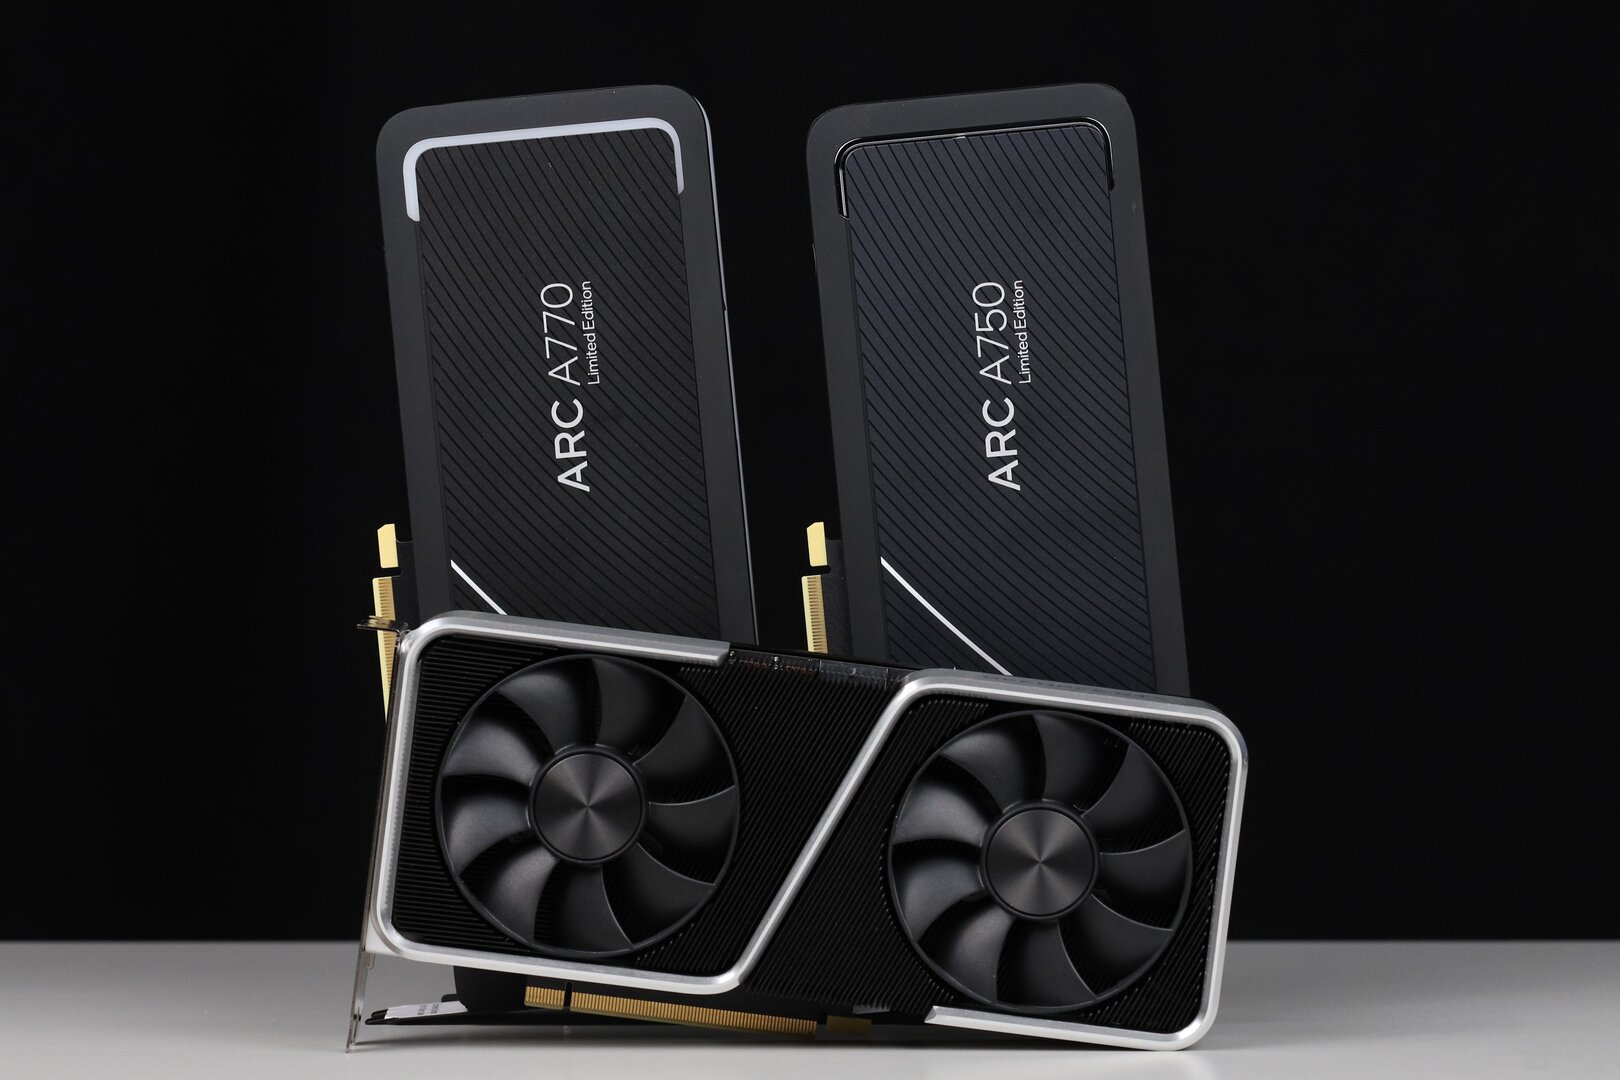
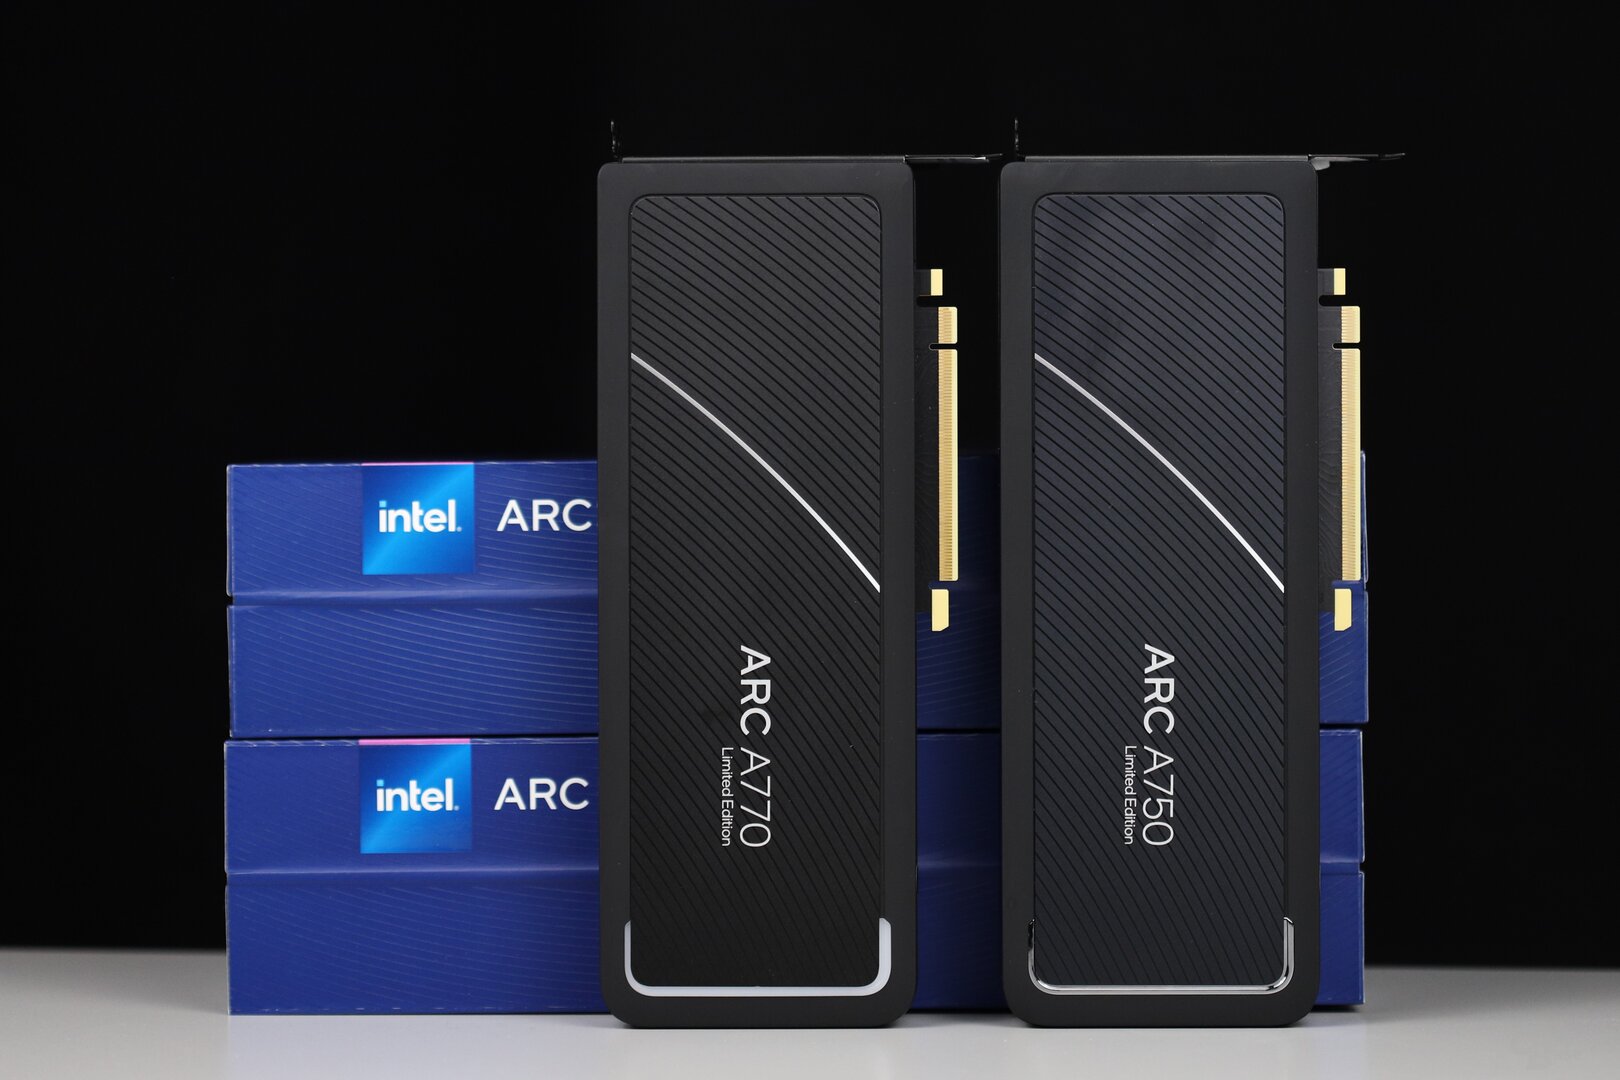
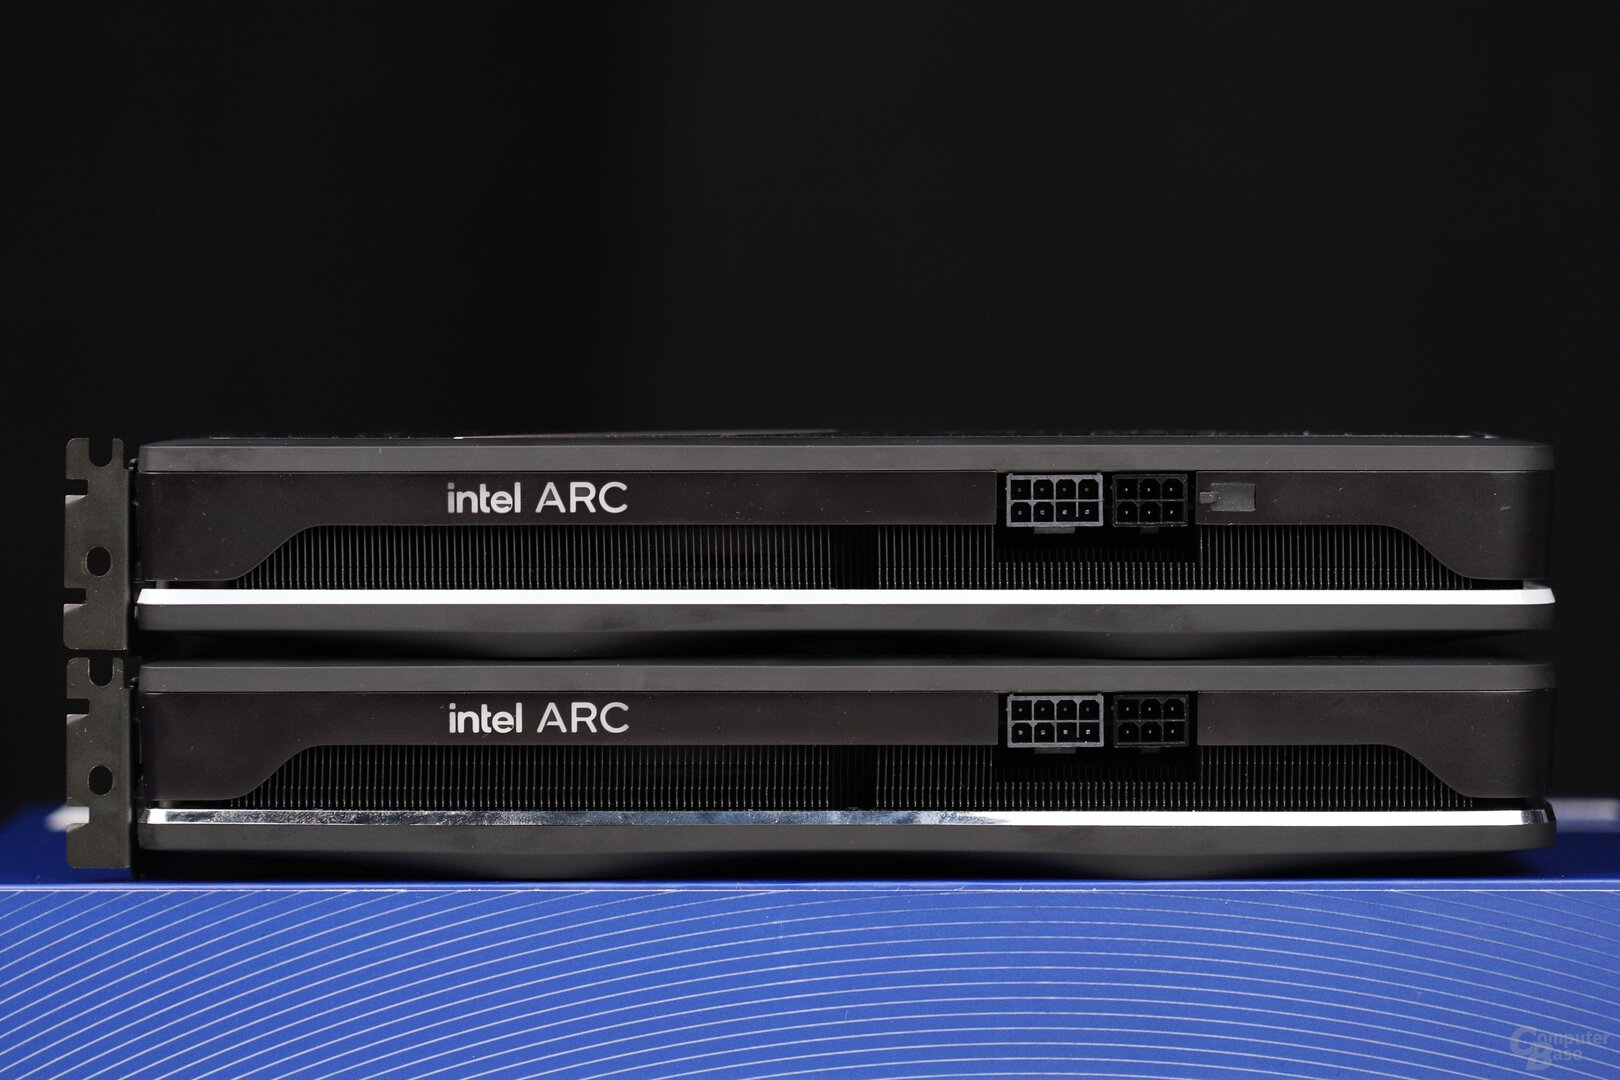 Intel Arc A770 vs. A750 Limited Edition: Externally identical except for accents and RGB LEDs (A770 only)
 Intel Limited Edition vs GeForce RTX 3060 Ti Founders Edition
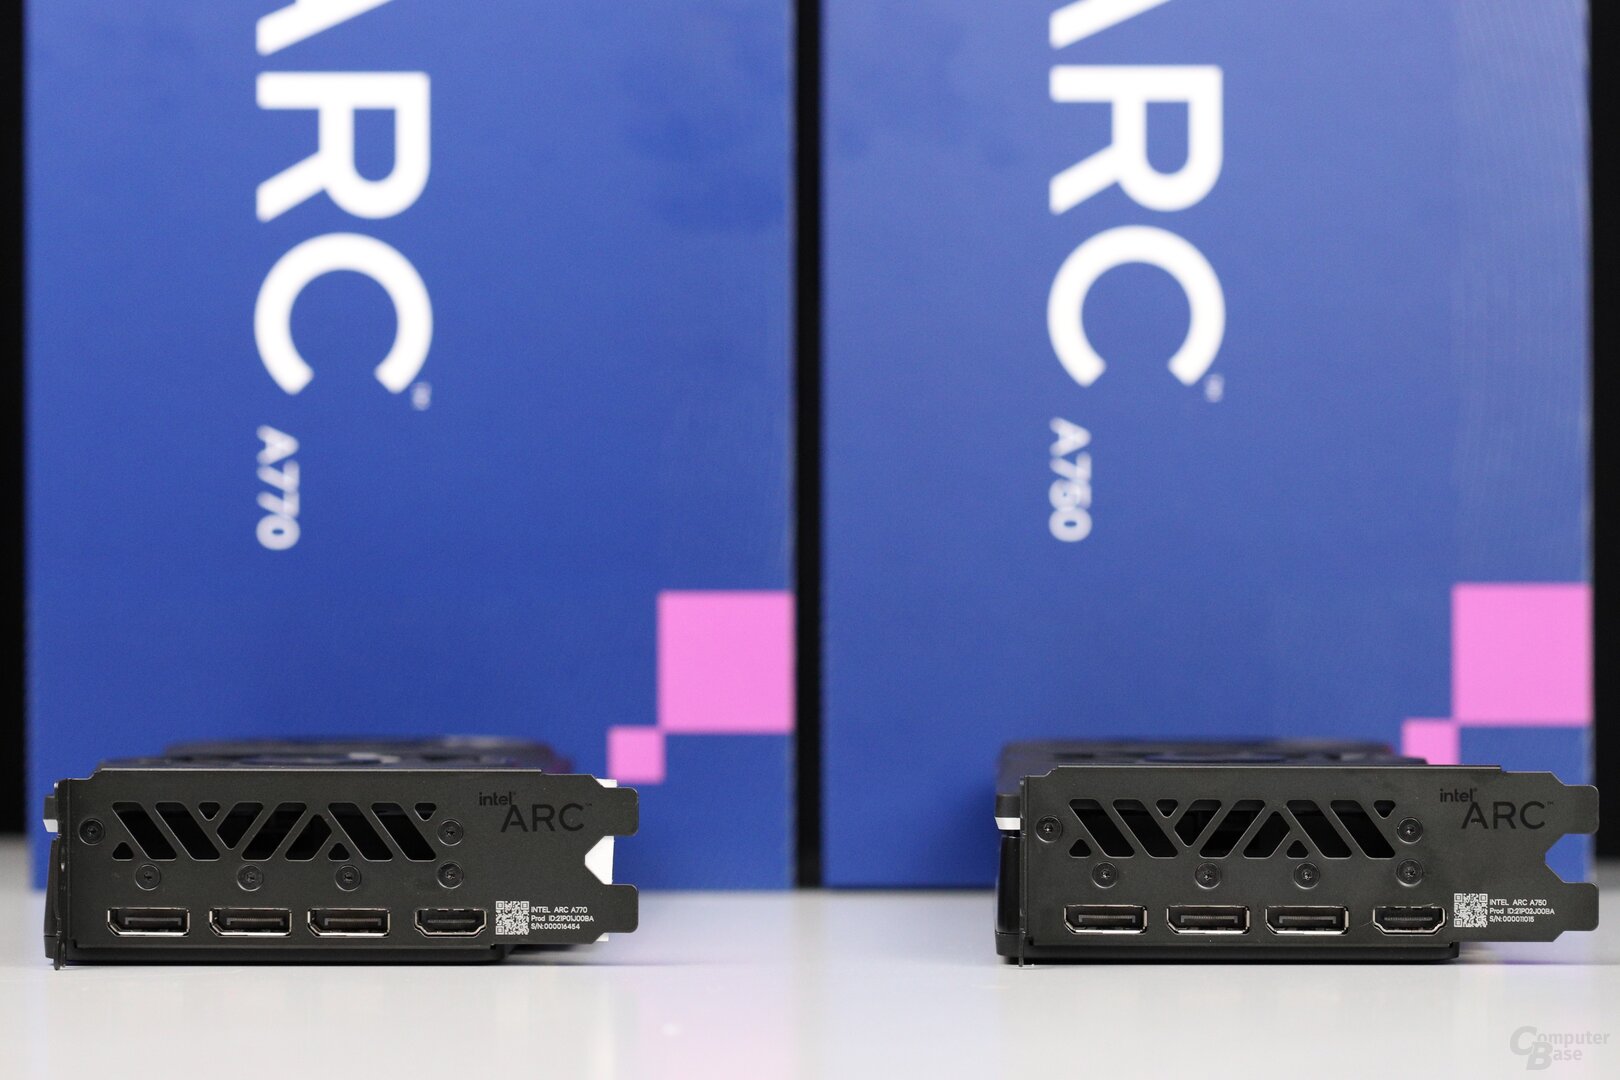 Intel Arc A770 vs. A750 Limited Edition: Externally identical except for accents and RGB LEDs (A770 only)
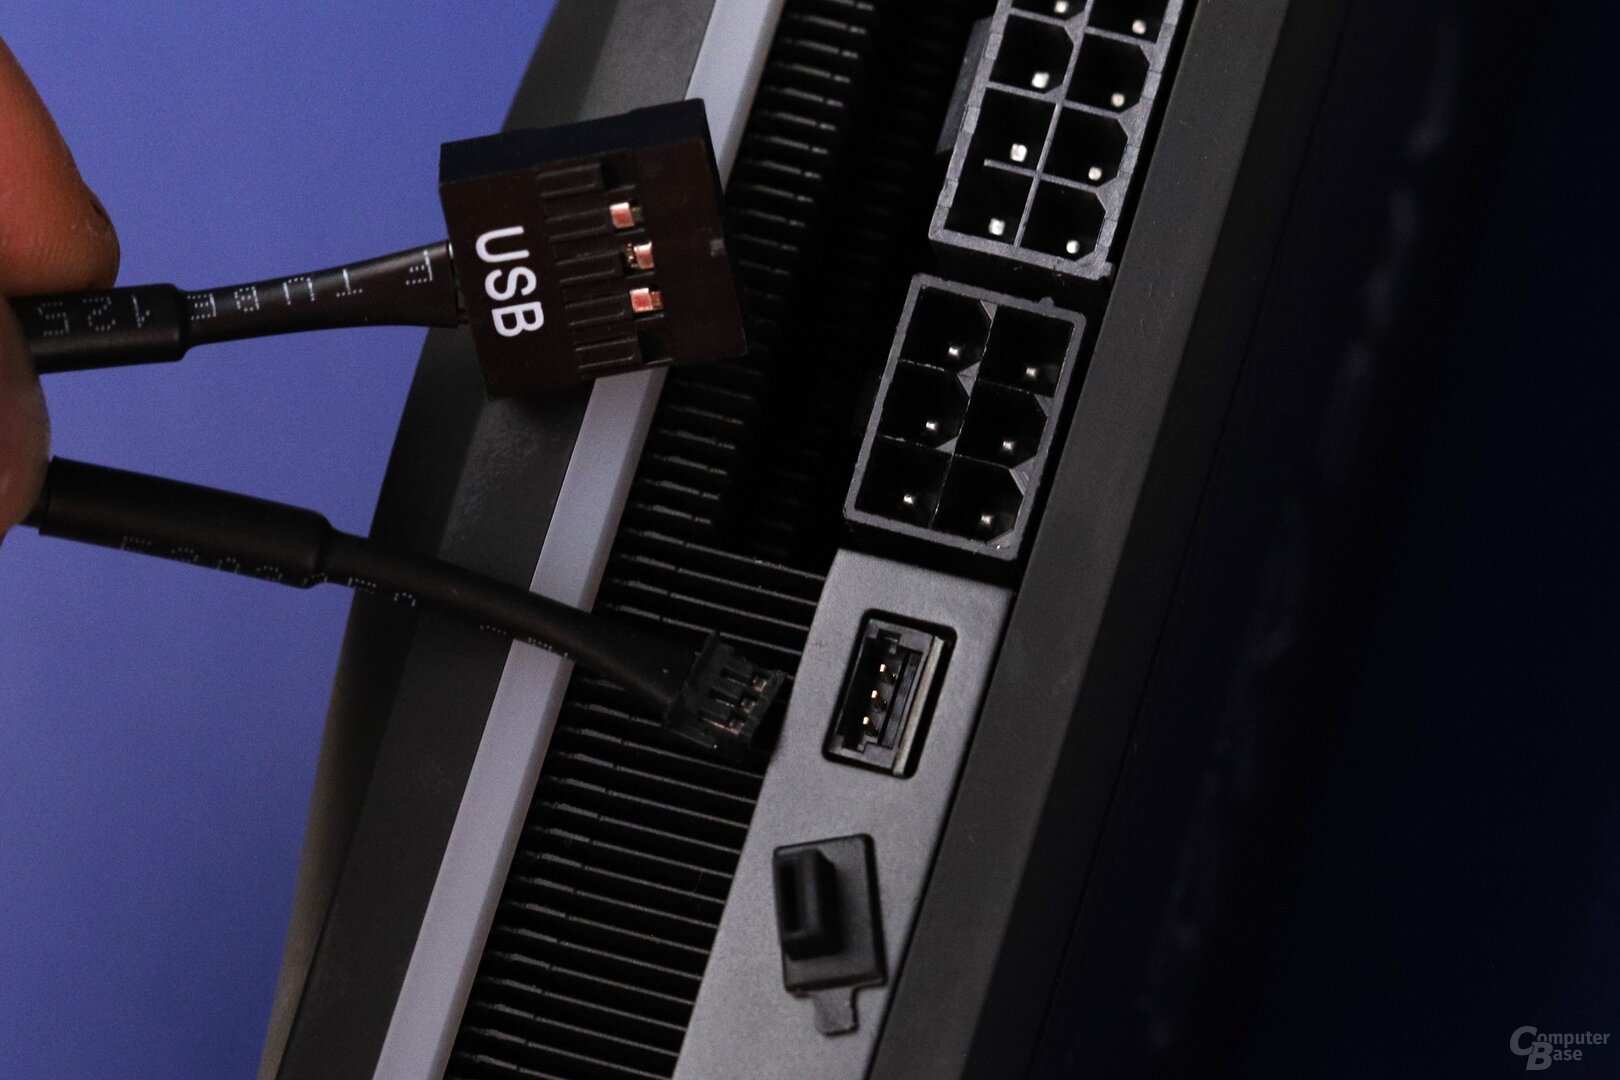 The RGB LEDs of the A770 Limited Edition are addressed via USB and not PCIe
The performance has increased slightly
Even if the performance has increased since the market launch, the Arc A770 in Full HD is still only as fast as the GeForce RTX 3060 and Intel's flagship has no chance against the Radeon RX 6650 XT. The graphics card should actually be dealing with much faster models, but the Radeon RX 6700 XT and GeForce RTX 3060 Ti are far ahead. The Arc A750 is 10 percent slower than the larger version, so the model operates in the Radeon RX 6600 range.
Anyway: it looks better in WQHD, that's where it is Arc A770 is slightly faster than the Radeon RX 6650 XT, which is still far from a top result, but at least shows that it can be done even faster.
The ray tracing performance of the Intel GPUs is really positive. Alchemist is clearly superior to AMD's RDNA 2 here and works pretty much on the same level as Nvidia's Ampere, which is definitely a highlight. But there's a catch there too – more on that later.
Arc Control Center is still annoying
There weren't any major problems with the driver during testing; this was different a few months ago. Ultimately, however, there are still numerous smaller construction sites, starting with graphic errors in games and games that would not close at all, right through to the Arc Control Center, which now works quite well, but is still simple as an overlay just annoying in many ways. Ultimately, the recommendation is still: do not install.
What remains is the sometimes bad frame pacing, which is really problematic in some games. In most of the titles, however, there are no longer any annoying hangers.
-
 Intel Arc A770 Limited Edition with 16 GB
Image 1 of 2
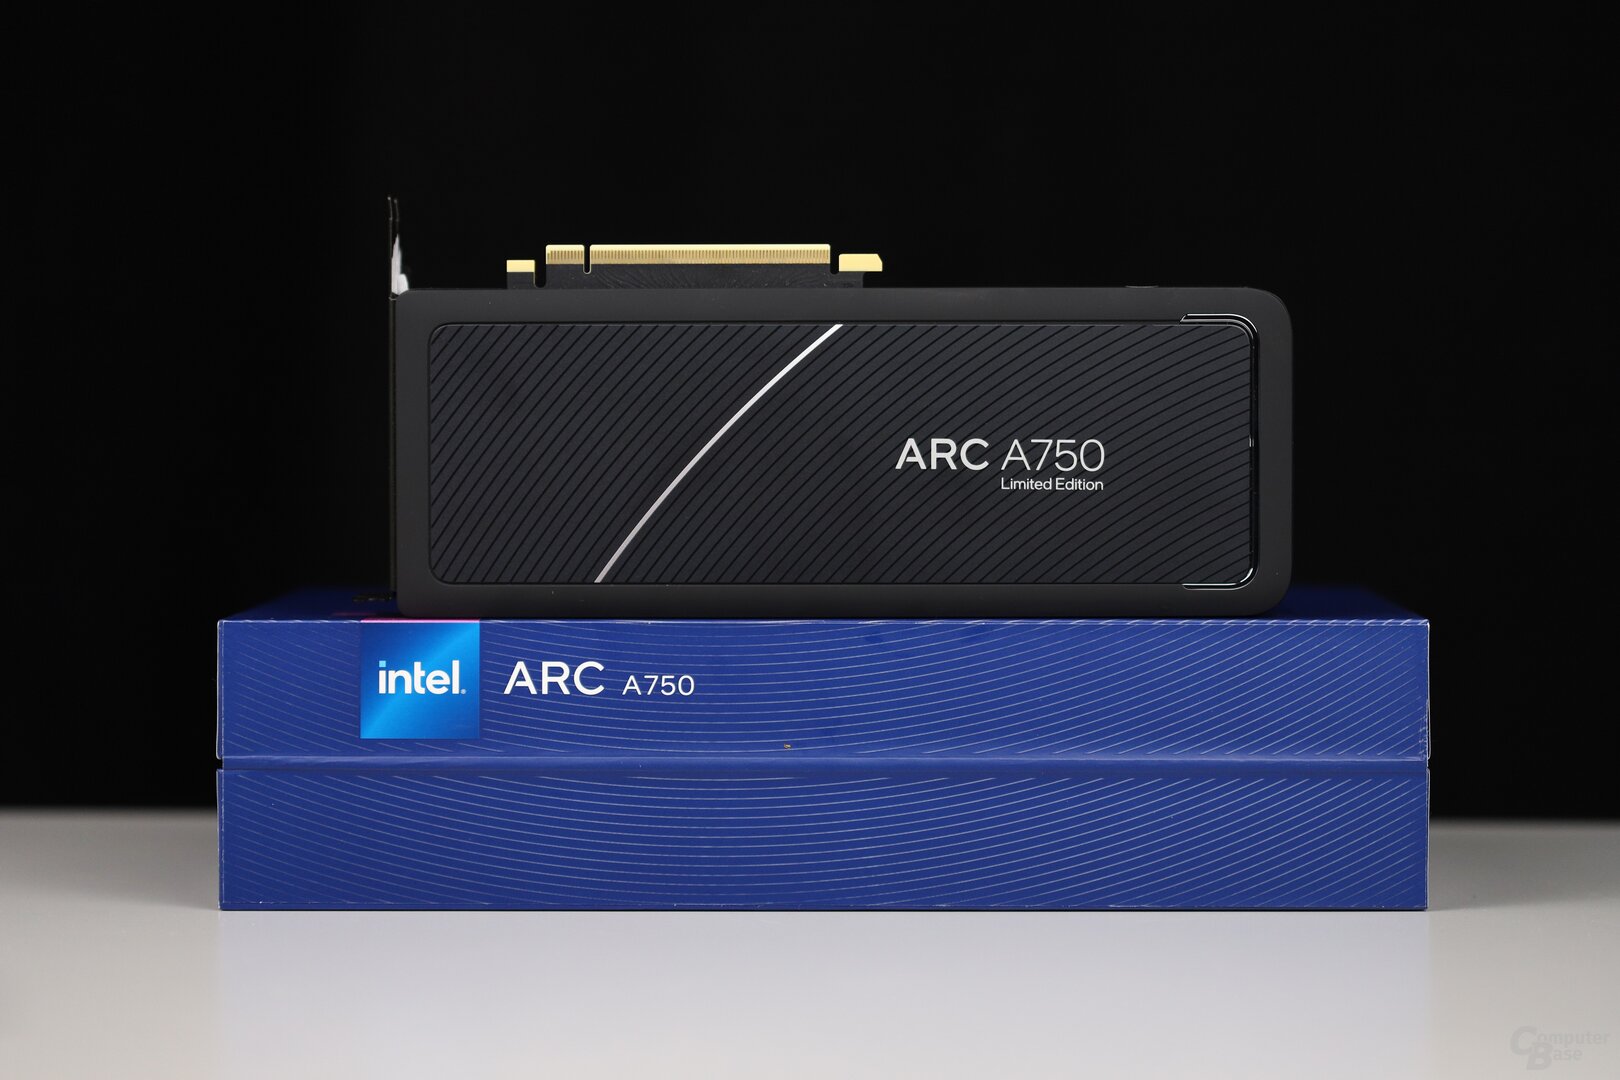 Intel Arc A750 Limited Edition 8GB
The price is still too high
The Arc A750 with 8 GB as a limited edition from Intel currently costs 328 euros* and the Arc A770 with 16 GB as a limited edition 427 euros*. In addition, ASRock is offering the A750 as a challenger in Germany for 319 euros*. Both price points ultimately remain overstated – even without considering the driver issues that still exist.
Because why should you spend 320 euros for the Arc A750 when you can get the clearly better Radeon RX 6650 XT for 10 euros more and the just as clearly better GeForce RTX 3060 for 20 euros more? With fewer issues, smooth performance, more raster FPS especially on the Radeon and more ray tracing FPS on the GeForce, and more VRAM. There isn't a single argument that speaks halfway in favor of the Arc A750.
The Arc A770 fares even worse. The hardware is definitely more balanced than the Arc A750 due to the 16 GB VRAM, but the GeForce RTX 3060 is already the better choice here. The graphics card has the same performance in Full HD, works much more reliably and costs 70 euros less. In contrast, the Arc A770 can only muster a few percent more FPS in WQHD. However, if you invest 20 more euros, you will get significantly more FPS in rasterizer games with the Radeon RX 6700 XT, the same number of FPS in RT games and a graphics card that is just as much more reliable. It's totally worth it.
So Intel still has a long way to go with the Arc graphics cards. The new drivers are positive, but ultimately there is still a lot missing. And since the Arc graphics cards are also surprisingly expensive, there is absolutely no reason to buy an Intel GPU. That sounds harsh, but that's how it is. And just buying Intel to support a third manufacturer is not the point either. Especially not if he doesn't even try to compensate for the disadvantages with the price.
ComputerBase received the hardware used on loan for testing. The manufacturers did not influence the test report and there was no obligation to publish it. There was no NDA.
(*) Links marked with an asterisk are affiliate links. In the case of an order via such a link, ComputerBase participates in the sales revenue without increasing the price for the customer.
This article was interesting, helpful or both? The editors are happy about any support from ComputerBase Pro and disabled ad blockers. More about ads on ComputerBase.