

The wait is over: After an immense delay, Intel's Alchemist gaming graphics cards, the Arc A770 and Arc A750, will be launched on October 12th. Your test with gaming and pro benchmarks compared to Nvidia GeForce and AMD Radeon shows: The time for Arc 1.0 is still not ripe, but it was over.
Table of Contents
- Intel Arc A770 and Arc A750 at a glance
- Intel's first time sample
- Limited editions vs. custom designs
- Technical key data at a glance
- A question of expectations
- GeForce RTX 3060, 3060 Ti or 3070?
- The price has to do it
- The API is decisive
- Test results and benchmarks
- GPU power and clock rates
- Game benchmarks in WQHD (2560×1440)
- Game benchmarks in FHD (1920×1080) with RT
- Game benchmarks in FHD (1920×1080)< /li>
- Game benchmarks in HD (1280 × 720)
- Gaming benchmarks in DirectX 9 titles
- Preliminary conclusion gaming performance
- App benchmarks
- Power consumption
- < li>Power consumption under load and when idling
- Performance losses with lower TDP
Overview of the Intel Arc A770 and Arc A750
Arc A770 and Arc A750 are Intel's flagship first-generation Arc graphics cards based on the Alchemist chip architecture. Both are aimed at PC gamers and users of professional (New German: creative) software. Arc doesn't get any faster in the first generation, because with the larger of the two SKUs, the large Alchemist GPU ACM-G10 is fully utilized. But how fast is fast?
Intel's first time pattern
Arc A770 and Arc A750 are the first graphics cards in the Arc series, whose market launch Intel – after a lot of PR over the past few months – is supporting globally with test samples and drivers under NDA. This was not the case with the previously available solutions for notebooks and the small desktop graphics card Intel Arc A380 – quite the opposite.

The graphics cards were made available from Intel last Thursday. The required driver was available for download on Thursday evening. In order to be able to deliver a meaningful article in time for the fall of the embargo (between Ryzen 7000 and GeForce RTX 4090), one aspect has so far been left out of the following consideration: Intel XeSS.
Because even if (after Ryzen 7000) the computers were running for the third weekend in a row, there was no time for a well-founded analysis of the AI upscaler. A review of the performance gains taking image quality into account is planned for a later date. The first games to support XeSS include Shadow of the Tomb Raider and Death Stranding: Director's Cut. A total of 20 titles have been announced so far.
 Intel Arc A770 Limited Edition 16GB
 Intel Arc A750 Limited Edition 8GB
 Intel Arc A770 vs. A750 Limited Edition: Externally identical except for accents and RGB LEDs (A770 only)
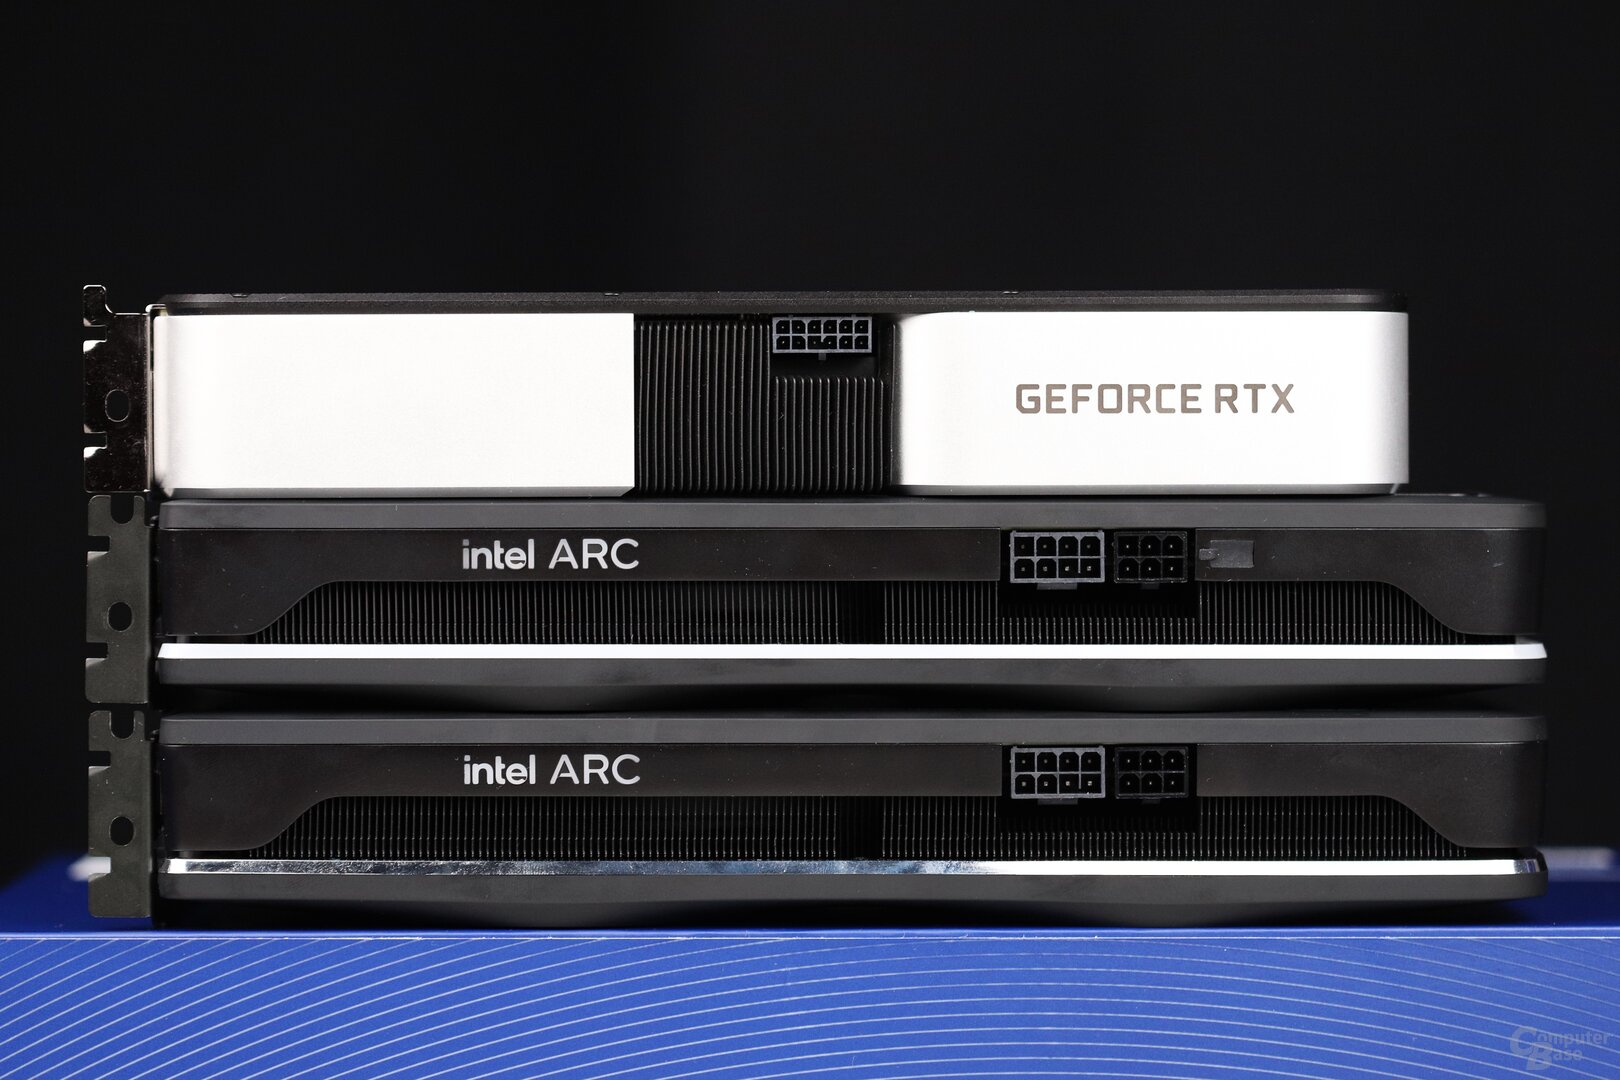 Intel's Limited Edition vs. GeForce RTX 3060 Ti Founders Edition
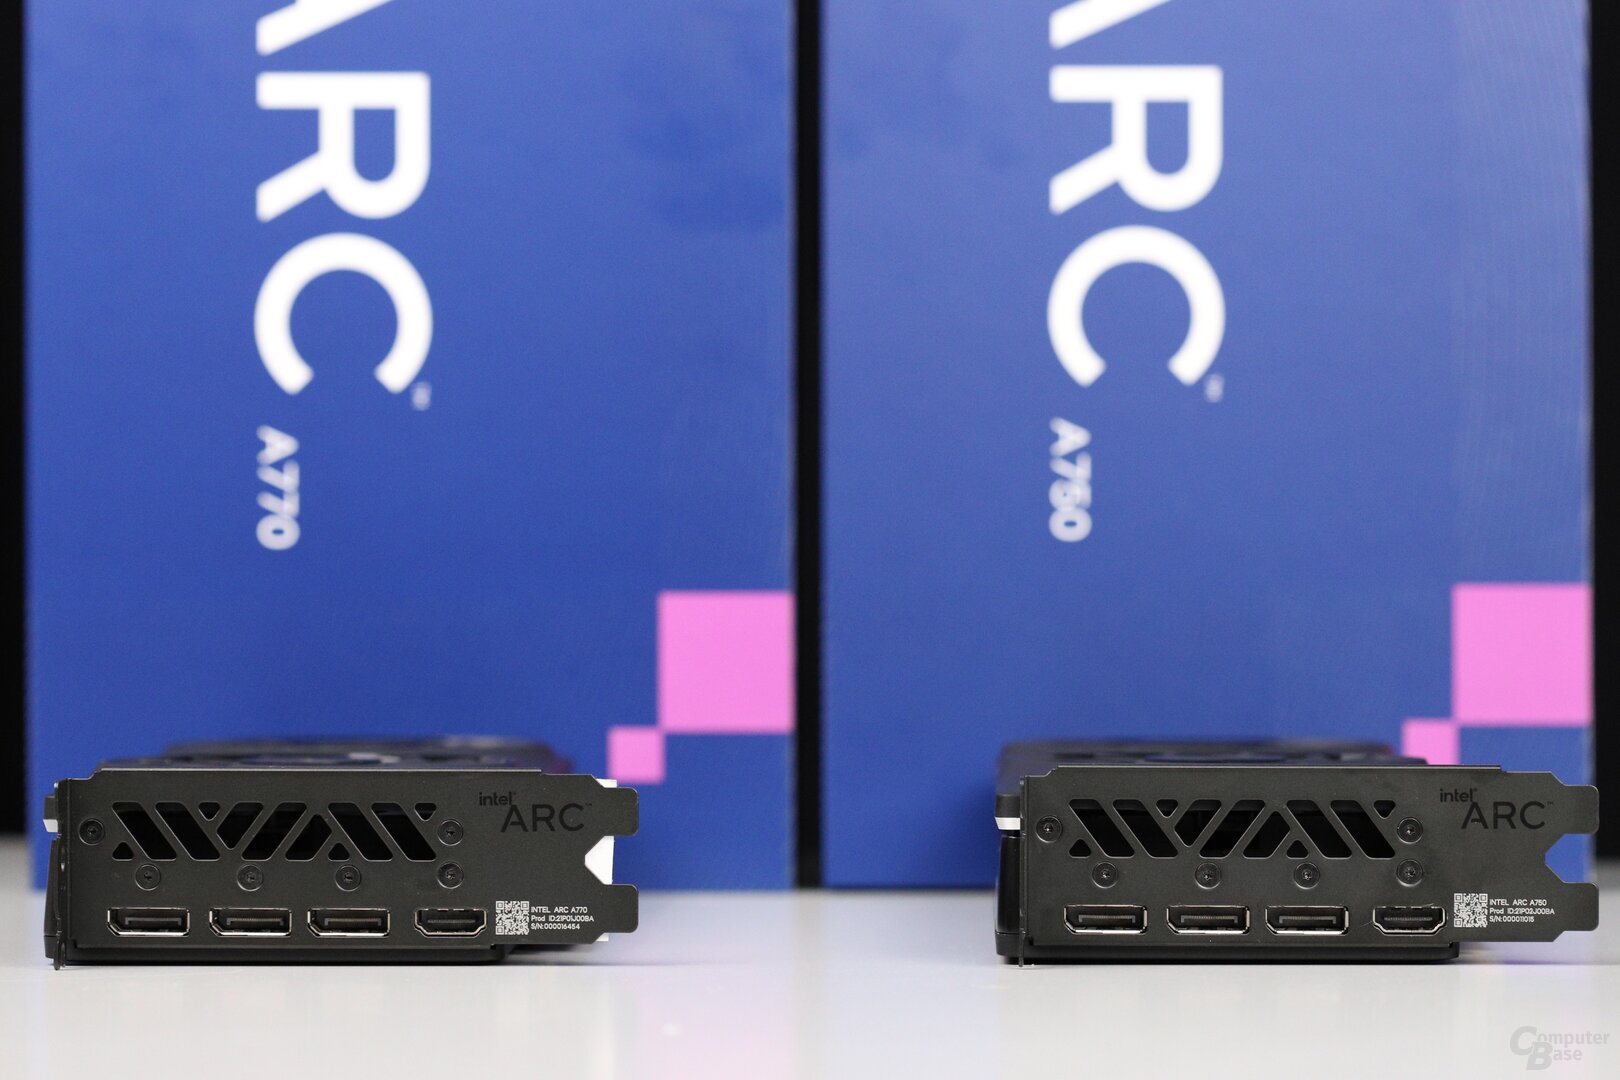 Intel Arc A770 vs. A750 Limited Edition: Externally identical except for accents and RGB LEDs (A770 only)
 The RGB LEDs of the A770 Limited Edition are addressed via USB and not PCIe
This article is about the Hardware as such and what it is capable of doing. Both graphics cards were available in the “Limited Edition”.
Limited Editions vs. Custom Designs
Intel's “Limited Edition” is the “Founders Edition” of the manufacturer. It is manufactured by Intel (in Malaysia) and marketed by Intel. Direct sales via the company's own shop are planned, but not yet ready for a decision.
The Arc A750 will only be available as a limited edition for the time being, board partners were obviously not interested in this class. The Arc A770 is again available as a limited edition with 16 GB (17.5 Gbps) and as a custom design with 8 GB (16.0 Gbps).
Both the Arc A770 Limited Edition and Arc A750 Limited Edition will be available in stores from October 12th. Intel sees this as certain for the USA, but the manufacturer could not confirm this for neighboring Canada last week. Intel could not or did not want to name an EIA for Germany before the embargo fell. It is also unclear when and where partners will be selling the Arc A770 with 8 GB.
Overview of key technical data
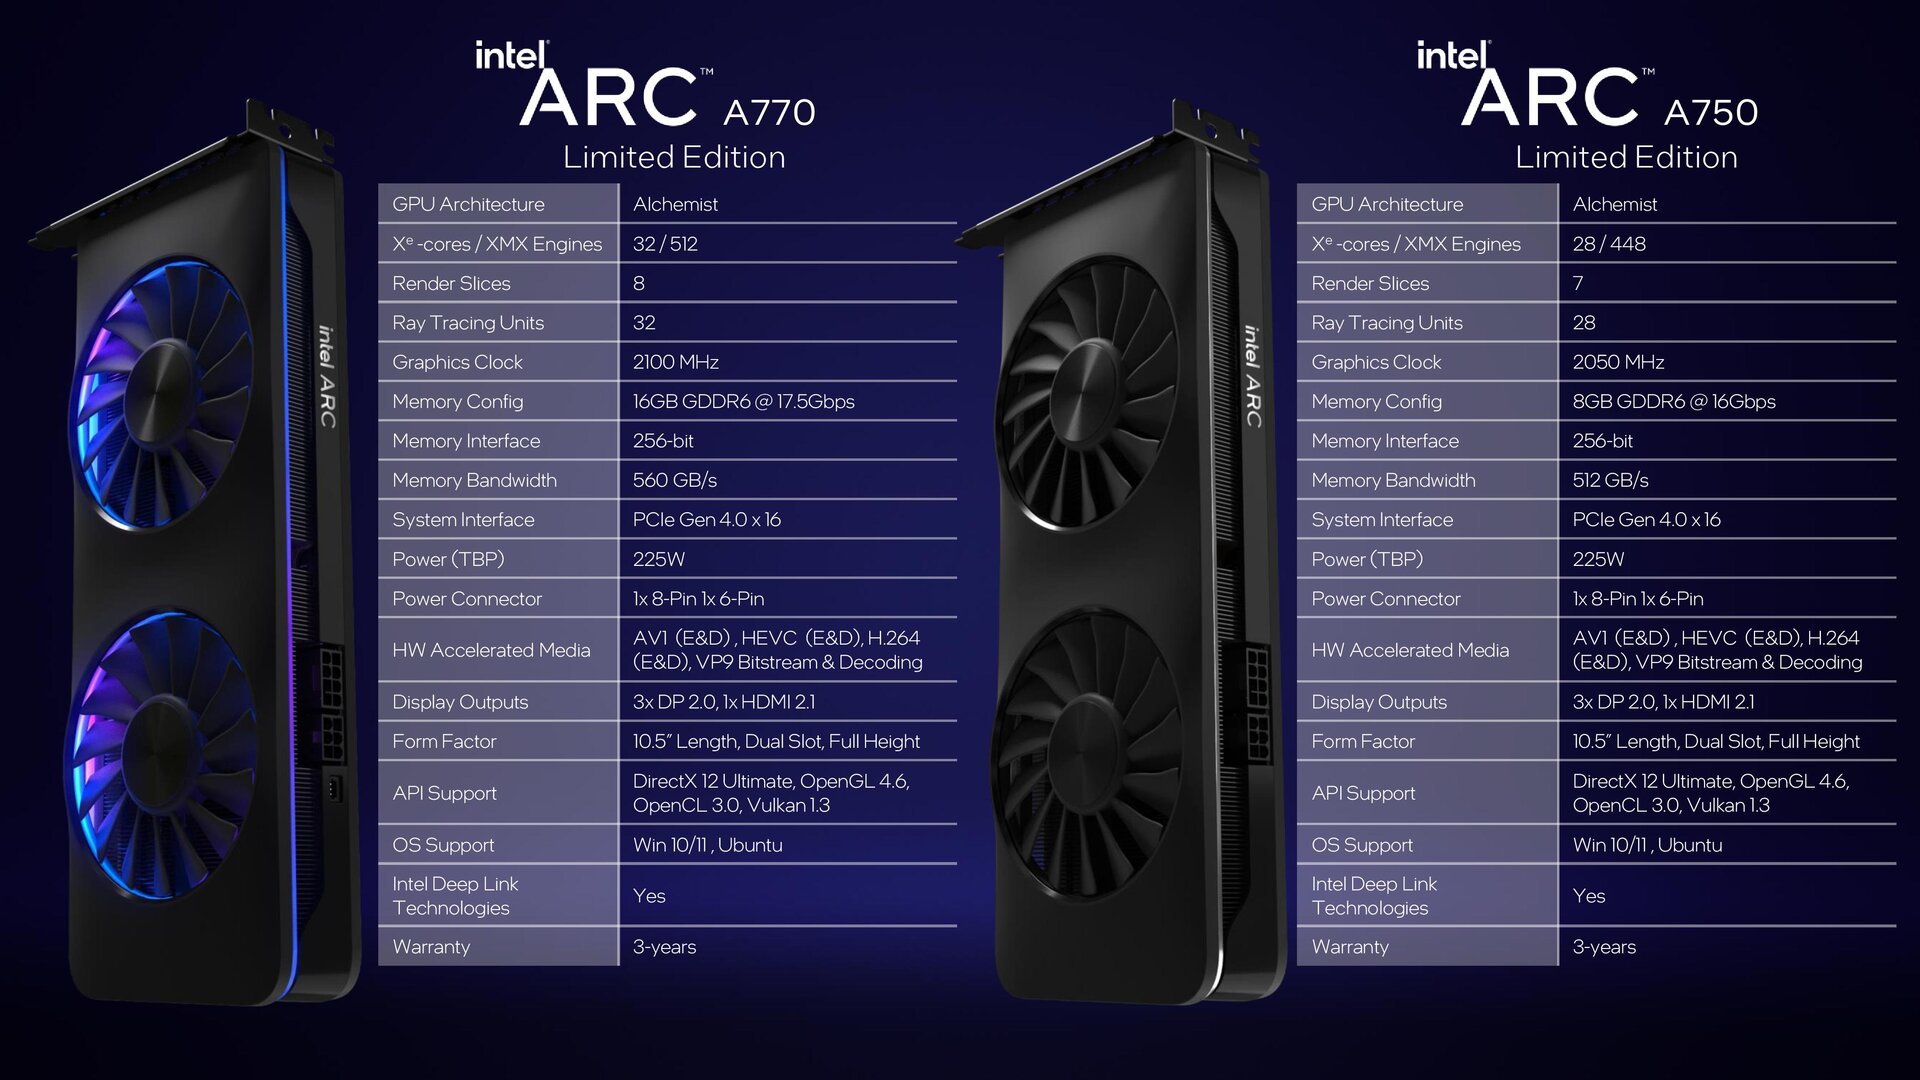
The table below gives an overview of the key technical data of the announced or proposed Intel Arc graphics cards for desktop PCs. Compared to the Arc A380 (test), both Arc A7xx offer more than three times as many shaders and a memory interface that is three times as wide. The increase in performance should therefore be considerable. There is still no date for the Arc A580, which corresponds to an Arc A730M (test) with a higher TDP.
64-bit 6GB
96 Bit 8GB
128 Bit 8GB
256 Bit 8GB
256 Bit 16GB
256-bit RGB lighting no yes Power consumption (graphics card) 75 watts 175 watts 225 watts Power consumption (GPU) 65 watts ? 190 watt RRP – – – USD 289 USD 329 USD 349
A question of expectation
There were rumors about the expected performance of the fastest Alchemist-based Arc graphics cards more than a year ago, while Intel officially kept a low profile. There was talk of the level of a GeForce RTX 3070, maybe even better. This year, the expectations fueled by rumors were scaled back – “between GeForce RTX 3060 and GeForce RTX 3070,” it said.
GeForce RTX 3060, 3060 Ti or 3070?
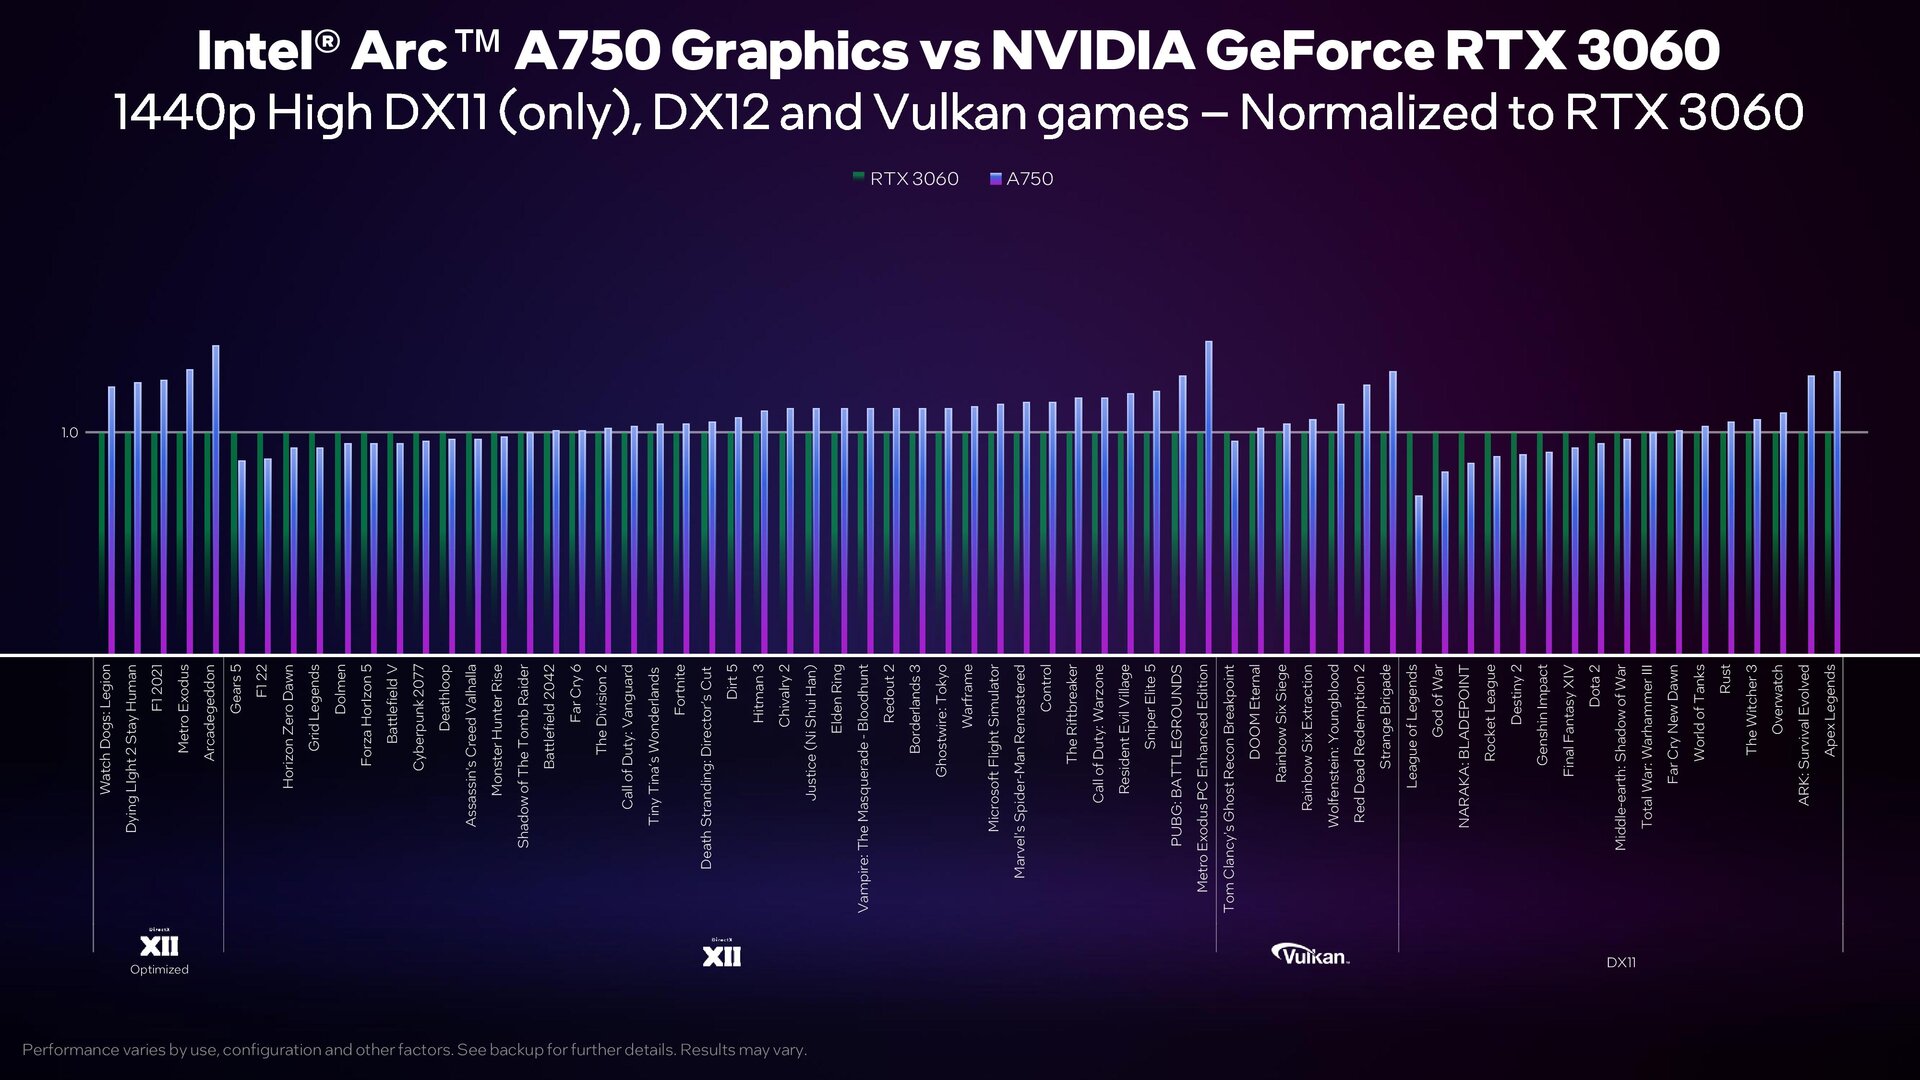
In July came Intel with its own benchmarks around the corner and promised that the Arc A750 would be able to clearly beat the GeForce RTX 3060 – in five selected DirectX 12 games. So should the Intel Arc A770 really be able to compete with even larger models?
Intel left that in the dark, but afterwards spoke offensively for the first time about the influence of the API, “Tier 1 games” with modern API and drivers adapted to it and in August only presented the comparison A750 to GeForce RTX 3060 in Vulkan and DirectX -12-Games.
Ultimately, it was only the final announcement of Arc A770 and Arc A750 that brought certainty: Both graphics cards “only” have the GeForce RTX 3060 as an opponent. GeForce RTX 3060 Ti and especially GeForce RTX 3070 are too fast even for the Arc A770.
 Intel Arc A770 (Ltd.) and Intel Arc A750 Ltd: prices and date (image: Intel)
The price has to determine
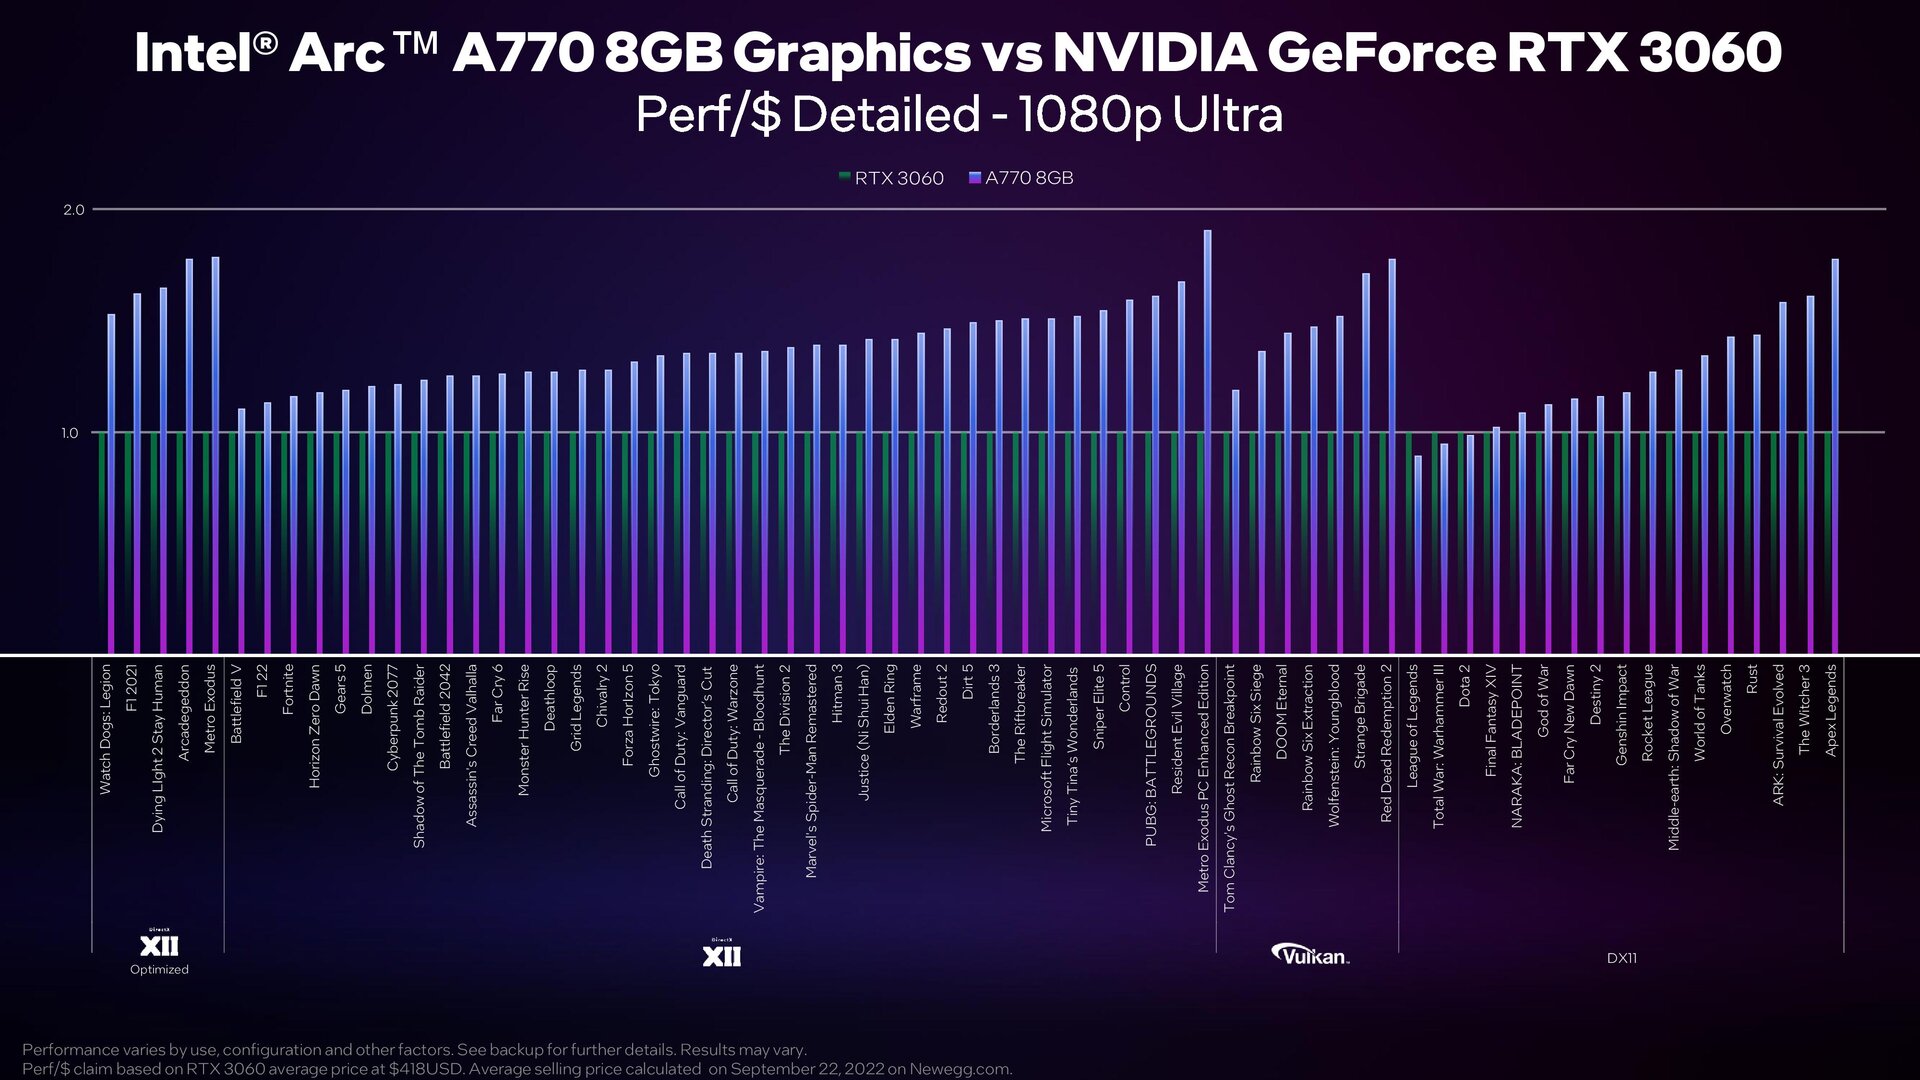
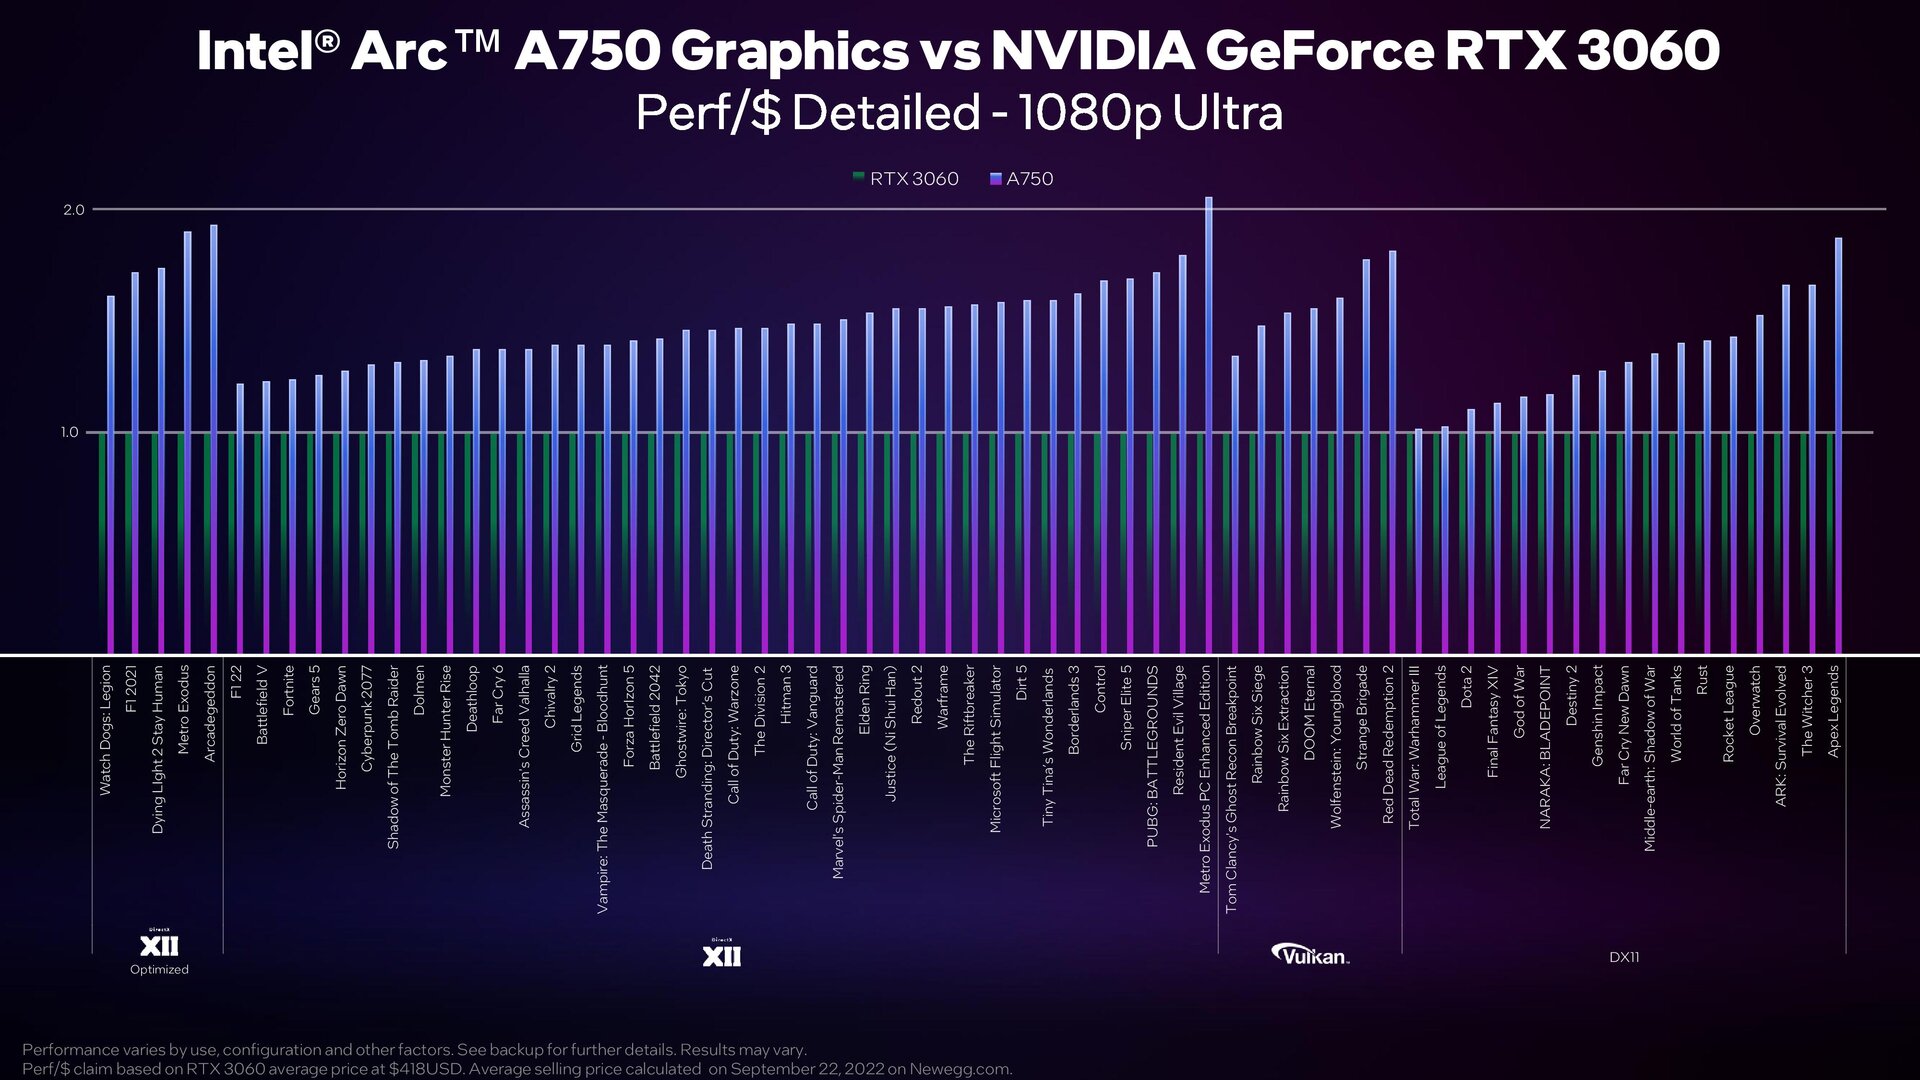
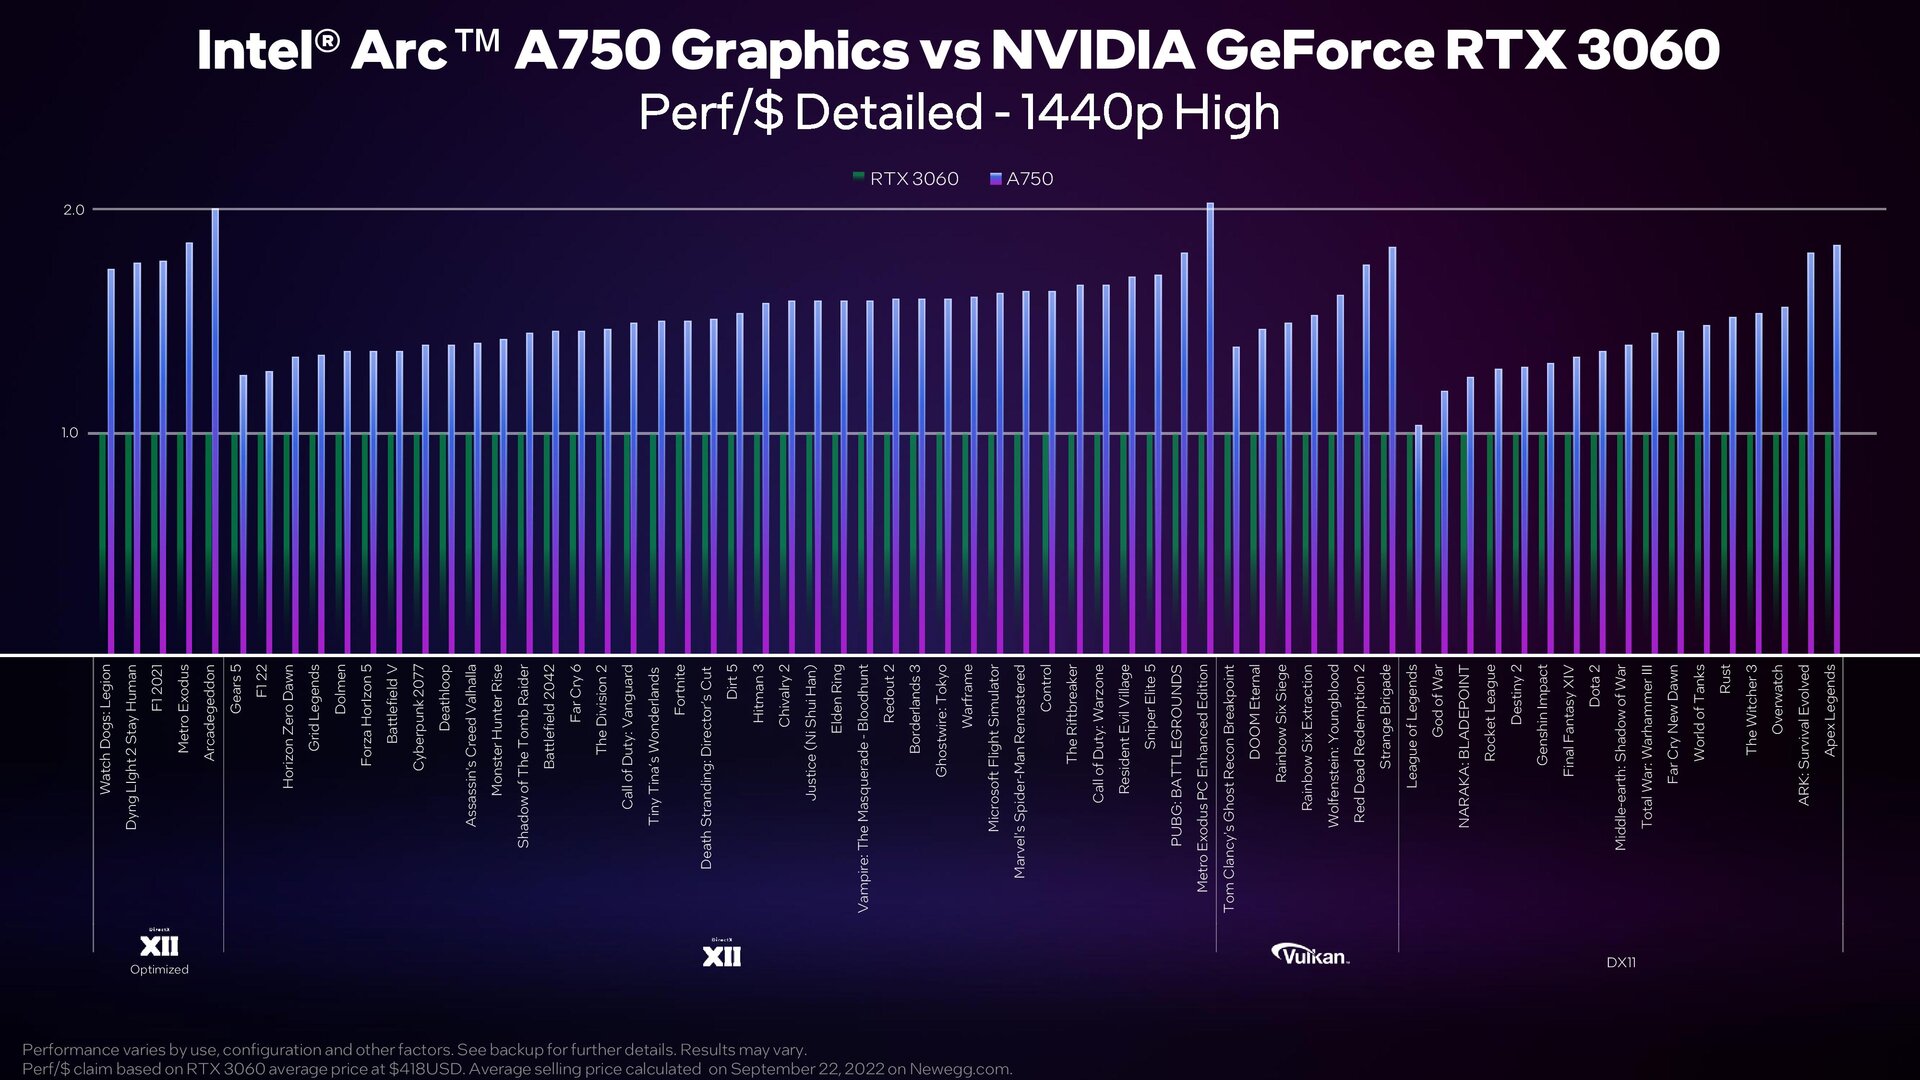
Only in WQHD did Intel use absolute FPS as a benchmark, in FHD, shortly before the start, only the ratio of price to performance compared to the GeForce RTX 3060 was used – based on the US RRP of the 8 GB version of the A770 or current average market prices (Nvidia). Nvidia brought this up insofar as the manufacturer once again pointed out the cheapest prices for RTX 3060 and RTX 3060 Ti in stores before the Intel embargo fell. So Arc doesn't leave the competition completely cold.
- < figure class="gallery__figure">
 Intel Arc A770 (Ltd.) and Intel Arc A750 Ltd: prices and date (image: Intel)
Image 1 of 4
Intel Arc A770 (Ltd.) and Intel Arc A750 Ltd: prices and date (Fig : Intel)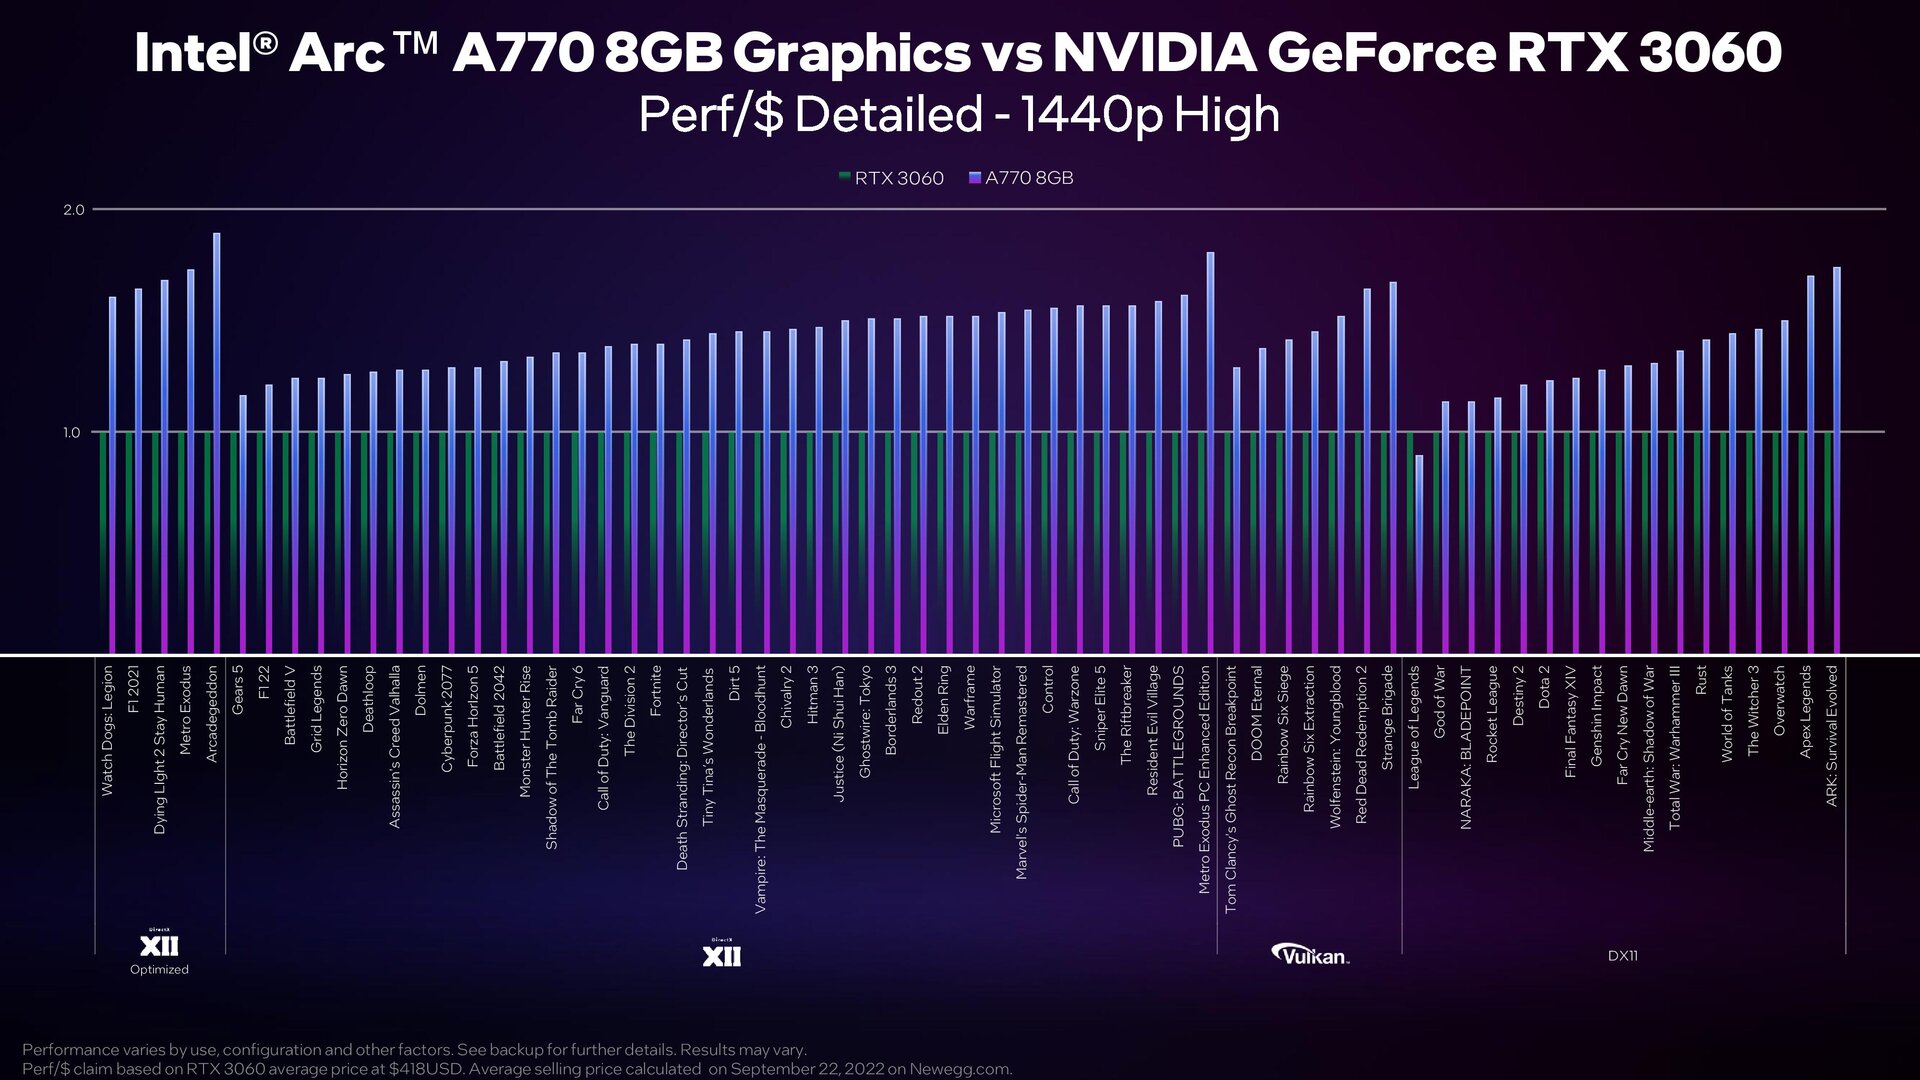
The API is crucial
With the move to the performance-per-price ratio, Intel published benchmarks for DirectX 11 titles for the first time and again pointed out that how Arc positions itself in relation to GeForce or Radeon depends very much on the API.< /p>
Officially, Intel Arc only supports the current APIs (DirectX 12, Vulkan 1.3, OpenGL 4.6 and OpenCL 3.0). The driver also understands DirectX 11 and DirectX 10, but the average performance is lower. DirectX 9 is completely left out.
Intel calls the API “Legacy API”, which, considering the introduction of DirectX 10 with Vista in 2006, is undoubtedly not wrong. Nevertheless, the translation from DirectX 9 to DirectX 12 used by Intel via Microsoft's D3D9On12 can still lead to problems today – more on that later.
 Intel Arc A770 (Ltd.) and Intel Arc A750 Ltd: prices and dates (Image: Intel)
Test results and benchmarks
ComputerBase recreated all gaming benchmarks used in the test at the end of September/beginning of October. The current game versions were used. The FPS and frame times were determined with CapFrameX, the telemetry data with HWiNFO. The games were tested with the following settings. The selection is made independently of Intel's own benchmarks or a specific consideration of the API used. Nevertheless, in the end most titles rely on the current DirectX 12, preferred by Intel, one on Vulkan and only two on DirectX 11. The course is therefore anything but disadvantageous for Arc.
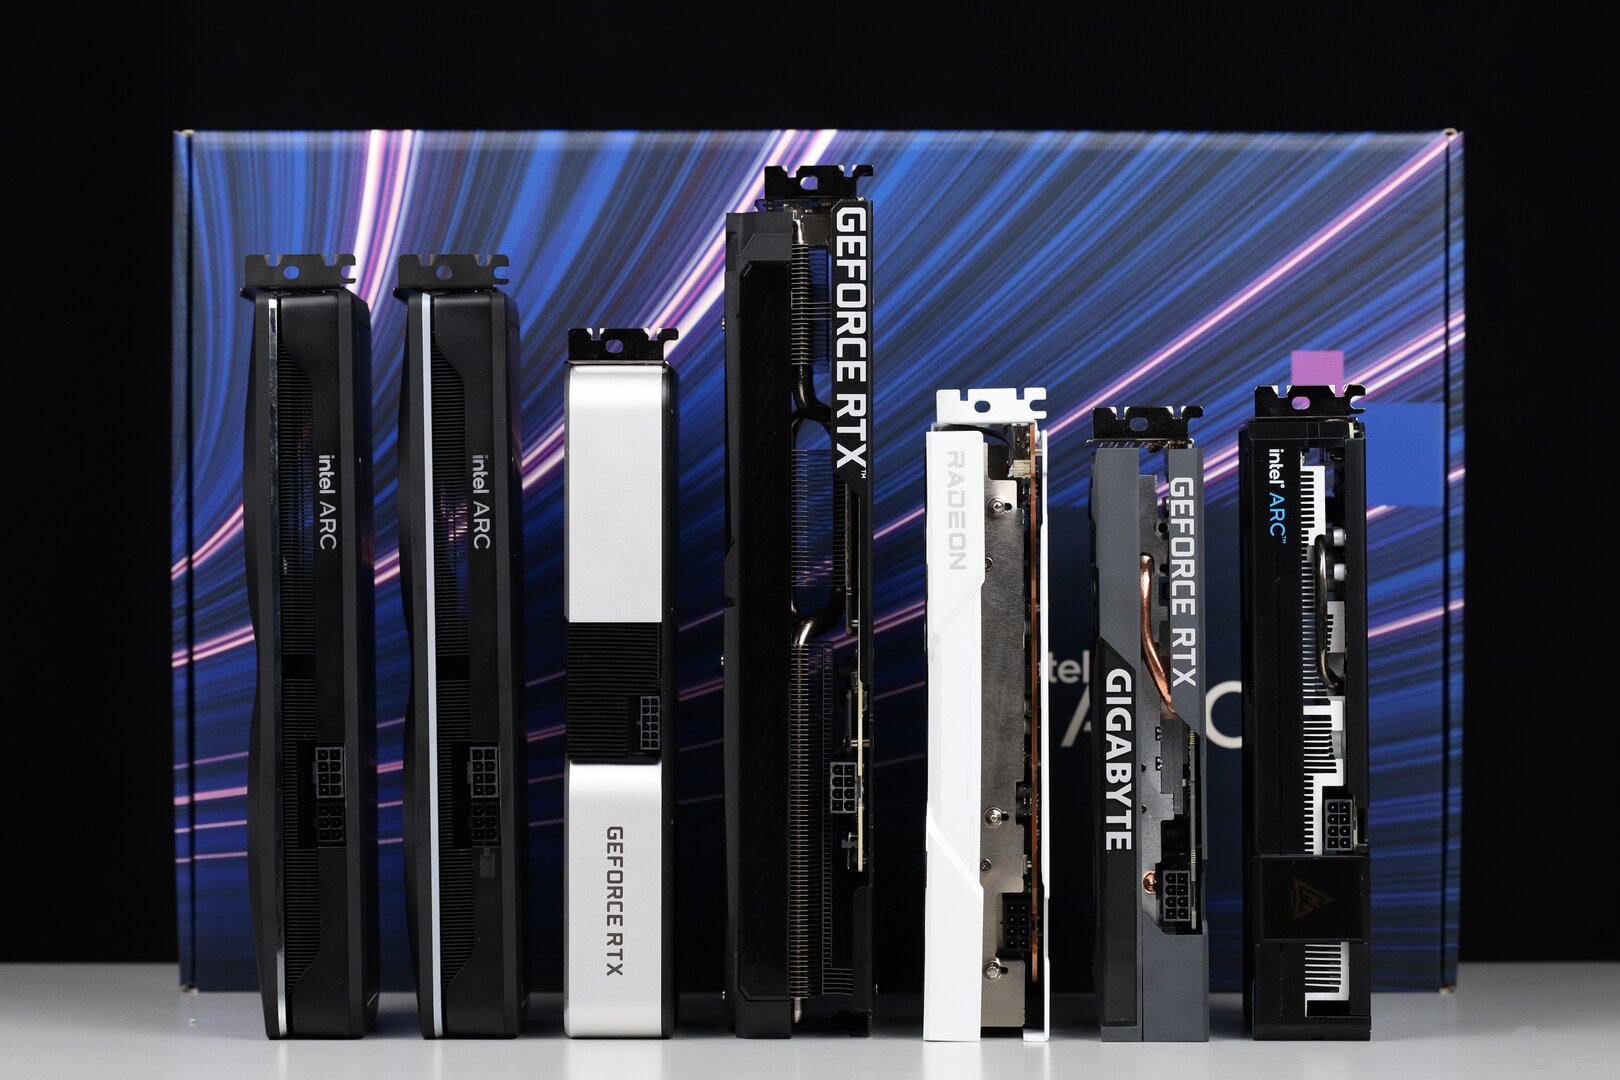 The test candidates: Arc A770, Arc A750, RTX 3060 Ti, RTX 3060, RX 6650 XT, RTX 3050 and Arc A380
The tests were carried out in WQHD, FHD and HD in order to be able to assess the graphics cards in both the GPU and CPU limits. In four games, ray tracing was also added in FHD.
FHD RT: RT Low/High, FSR/DLSS Off
HD: Ultra/High + FSR Performance Death Stranding: Directors Cut DirectX 12 WQHD, FHD: Very High
HD: Very High, FSR 1.0 Performance Doom Eternal Vulkan WQHD, FHD, HD: Ultra
FHD RT: Ultra, RT on Dota 2 DirectX 11 Maximum details F1 22 DirectX 12 Ultra High, RT off, TAA, 16x AF, FidelityFX Sharpening Guardians DirectX 12 QWHD, FHD: Ultra High
FHD RT: Ultra High, RT High
HD: Ultra High, FSR 1.0 Performance SotTR DirectX 12 Maximum Details, TAA Spider-Man DirectX 12 FHD, HD: Very High, SSAO
WQHD: High
FHD RT: Very High, RT High The Witcher 3 DirectX 11 General : High (without Hairworks)
Postprocessing: Highest
It was tested on a Ryzen 7 7700X (test) with 32 GB DDR5-5200CL32, on which a current Windows 11 2022 was installed. Intel Arc first used version 3430 and later version 3435, which fixed some errors, as the driver. Both drivers were initially only available to the press. The Nvidia GeForce was tested with the GeForce 517.84, the AMD Radeon with the Adrenalin 22.9.2. rBAR was active.
 Screenshot (62)
 Screenshot (63)
GPU power and clocks
Intel Arc A770 Ltd. and Arc A750 Ltd. come to the customer with the same power budget despite different expansion stages of the ACM G10 GPU and 16 vs. 8 GB memory: Both allow the GPU 190 watts and the entire graphics card 225 watts.
There are differences in the clock rates: According to Intel, the A770 typically clocks the GPU at 2,100 MHz and the memory at 17.5 Gbps, with the A750 it is 2,050 and 16.0 Gbps respectively. There is again agreement on the maximum permissible clock rate: 2,400 MHz is the maximum permissible in both cases without manual intervention (OC).
A first look at the course of the GPU power and the clock rates in 3DMark Time Spy shows: Both graphics cards fully utilize the 190 watts of GPU power in the factory state in both GPU tests. The ARC A770 clocks a little below the upper limit of 2,400 MHz, the ARC A750 also scores the clock space over large parts of the benchmark. “svgchart-items” style=”column-count:2″>
This explains why the Arc A770 with Maximized GPU power limit (228 instead of 190 watts) also makes use of it and becomes faster in 3DMark Time Spy, while the Arc A750 remains virtually unaffected by this: Without manually raising the upper clock limit, the smaller of the two graphics cards cannot handle the higher power budget at all into more beat.
3DMark Time Spy – GPU Clock 06001.2001.8002.4003.000Mhash/s 1102030405060708090100110120130140150160170180190200seconds
- Intel Arc A770 (228W GPU)
- Intel Arc A750 (190W GPU)
- Intel Arc A750 (228W GPU)
This does not only apply to the 3DMark Time Spy. A higher power target on the A750 is usually of no use in games either, because the maximum clock of 2,400 MHz was already reached with the factory budget. So much for theory.
Game benchmarks in WQHD (2,560 × 1,440)
On average across all games in the course, the Arc A770 in WQHD is 1 percent ahead of the GeForce RTX 3060 in FPS, the Arc A750 only 7 percent behind. In this case, the Radeon RX 6650 XT remains almost 5 percent ahead, the GeForce RTX 3060 Ti is 27 percent faster than the Arc A770 in the factory state.
If the GPU power target is increased from 190 to 228 watts, the performance increases by only 2 percent on average, because the maximum permitted clock of 2,400 MHz does not allow the graphics card to make use of the higher budget in every title. The A770 is up to 5 percent faster.
WQHD benchmarks
- Performance rating FPS
- Performance Rating Frametimes
Edit WQHD Benchmarks – Performance Rating FPS Incoming Charts All None
- WQHD benchmarks – Anno 1800: FPS
- WQHD Benchmarks – Cyberpunk 2077: FPS
- WQHD Benchmarks – Death Stranding DC: FPS
- WQHD Benchmarks – Doom Eternal: FPS
- WQHD Benchmarks – Dota 2: FPS
- WQHD Benchmarks – F1 22: FPS
- WQHD Benchmarks – Guardians: FPS
- WQHD Benchmarks – SotTR: FPS
- WQHD Benchmarks – Spider-Man: FPS
- WQHD Benchmarks – The Witcher 3: FPS
-
- GeForce RTX 3060 Ti, 200W
7700X, DDR5-5200, FE100 - Radeon RX 6650 XT, 180W
7700X, DDR5-5200, PC Hellhound82 - Arc A770, 290W (GPU: 228W)
7700X, DDR5-5200, Limited80 - < strong>Arc A770, 225 W (GPU: 190 W)
7700X, DDR5-5200, Limited79 - GeForce RTX 3060, 170 W
7700X, DDR5-5200, Asus TUF78 - Arc A750, 225W (GPU: 190W)
7700X, DDR5-5200, Limited73 - GeForce RTX 3050, 130W
7700X, DDR5- 5200, Gigabyte Eagle54
- GeForce RTX 3060 Ti, 200W
Unit: Percent Edit WQHD Benchmarks – Performance Rating Frametimes Input Charts All None
- WQHD Benchmarks – Anno 1800: Frame times (1% percentile)
- WQHD benchmarks – Cyberpunk 2077: Frame times (1% percentile)
- WQHD benchmarks – Death Stranding DC: Frame times (1% percentile )
- WQHD Benchmarks – Doom Eternal: Frametimes (1% Percentile)
- WQHD Benchmarks – Dota 2: Frametimes (1% Percentile)
- WQHD Benchmarks – F1 22: Frametimes (1st % Percentile)
- WQHD Benchmarks – Guardians: Frametimes (1% Percentile)
- WQHD Benchmarks – SotTR: Frametimes (1% Percentile)
- WQHD- Benchmarks – Spider-Man: Frametimes (1% Percentile)
- WQHD Benchmarks – The Witcher 3: Frametimes (1% Percentile)
-
- GeForce RTX 3060 Ti, 200W
7700X, DDR5-5200, FE100 - Radeon RX 6650 XT, 180W
7700X, DDR5-5200, PC Hellhound84
< li class="chart__row">GeForce RTX 3060, 170W
7700X, DDR5-5200, Asus TUF80 - GeForce RTX 3060 Ti, 200W
- Arc A770, 290W (GPU: 228W)
7700X, DDR5-5200, Limited75 - Arc A770, 225W (GPU: 190W)
7700X, DDR5-5200, Limited74 - Arc A750, 225W (GPU: 190W)
7700X, DDR5-5200, Limited69 - GeForce RTX 3050, 130W
7700X, DDR5-5200, Gigabyte Eagle56
Unit: percent
A look at the individual results shows that the distances between the GeForce RTX 3060 and the two Arc graphics cards vary greatly: In Dota 2 and F1 22, things are not looking good for Arc, but in The Witcher 3 – interestingly with DirectX 11 – it is almost the RTX 3060 Ti achieves. An absolute exception in the course.
Arc performs somewhat worse in the 1% percentile frame times: Here, Nvidia's RTX 3060 is 8 percent ahead of the Arc A770. In particular, it is again Dota 2, F1 22 and also Guardians of the Galaxy that cloud the picture – it looks better in other games.
Game benchmarks in FHD (1920 × 1080) with RT
Will be converted from WQHD to FHD changed, but ray tracing activated, confirms that Intel's Alchemist architecture can almost catch up with Nvidia Ampere in this discipline. Although the GeForce RTX 3060 is now ahead of the Arc A770 on average, the gap is small – and the Radeon RX 6650 XT is now clearly beaten. The frame times, on the other hand, are a bit worse in this case.
Full HD RT benchmarks
- FPS performance rating
- Performance Rating Frametimes
Edit Full HD RT Benchmarks – Performance Rating FPS Inflow Charts All None
- FHD -RT Benchmarks – Cyberpunk 2077: FPS
- FHD RT Benchmarks – Doom Eternal: FPS
- FHD RT Benchmarks – Guardians: FPS
- FHD RT Benchmarks – Spider-Man: FPS
- < ul class="chart__group-body">
- GeForce RTX 3060 Ti, 200W
7700X, DDR5-5200, FE100 - GeForce RTX 3060, 170W
7700X, DDR5-5200, Asus TUF78 - Arc A770, 290W (GPU: 228W)
7700X, DDR5- 5200, Limited75 - Arc A770, 225W (GPU: 190W)
7700X, DDR5-5200, Limited75 - Arc A750, 225W (GPU: 190W )
7700X, DDR5-5200, Limited68 - Radeon RX 6650 XT, 180 W
7700X, DDR5-5200, PC Hellhound57
< li class="chart__row">GeForce RTX 3050, 130 W
7700X, DDR5-5200, Gigabyte Eagle50
Unit: Percent Edit Full HD RT Benchmarks – Performance Rating Frametimes Inflowing Charts All None
- FHD RT benchmarks – Cyberpunk 2077: Frame times (1% percentile)
- FHD RT benchmarks – Doom Eternal: Frame times (1% percentile)
- FHD RT benchmarks – Guardians: Frametimes (1% Percentile)
- FHD RT Benchmarks – Spider-Man: Frametimes (1% Percentile)
-
- GeForce RTX 3060 Ti, 200W
7700X, DDR5 -5200, FE100 - GeForce RTX 3060, 170W
7700X, DDR5-5200, Asus TUF78 - Arc A770, 290W (GPU: 228W)
7700X, DDR5-5200, Limited70 - Arc A770, 225W (GPU: 190W)
7700X, DDR5-5200, Limited69 - Arc A750, 225W (GPU: 190W)
7700X, DDR5-5200, Limited64 - Radeon RX 6650 XT, 180W
7700X, DDR5-5200, PC Hellhound52 - GeForce RTX 3050, 130W
7700X, DDR5-5200, Gigabyte Eagle49
- GeForce RTX 3060 Ti, 200W
Unit: percent
Game benchmarks in FHD (1920 × 1080)
In Full HD without ray tracing, Intel Arc falls behind Nvidia GeForce and AMD Radeon in terms of FPS: On average, Alchemist loses 10 percent to the competition. In comparison to the Radeon RX, this also applies to the frame times, but not quite in comparison to the GeForce RTX 3060.
Full HD benchmarks
- < li class="chartbundle-tabs__li" role="presentation">Performance Rating FPS
- Performance Rating Frametimes
Edit Full HD Benchmarks – Performance Rating FPS Inflow Charts All None
- Full HD Benchmarks – Anno 1800: FPS
- Full HD Benchmarks – Cyberpunk 2077: FPS
- Full HD Benchmarks – Death Stranding DC: FPS
- Full HD Benchmarks – Doom Eternal: FPS
- Full HD Benchmarks – Dota 2: FPS
- Full HD benchmarks – Guardians: FPS
- Full HD benchmarks – SotTR: FPS
- Full HD benchmarks – Spider-Man: FPS
- Full HD benchmarks – The Witcher 3: FPS
li>
< li>Full HD benchmarks – F1 22: FPS
-
- GeForce RTX 3060 Ti, 200W
7700X, DDR5-5200, FE100 - Radeon RX 6650 XT, 180W
7700X, DDR5-5200, PC Hellhound86 - GeForce RTX 3060, 170W
7700X, DDR5-5200, Asus TUF79 - Arc A770, 225W (GPU: 190 W)
7700X, DDR5-5200, Limited74 - Arc A750, 225W (GPU: 190W)
7700X , DDR5-5200, Limited70 - GeForce RTX 3050, 130W
7700X, DDR5-5200, Gigabyte Eagle57 - Arc A380, 75W (GPU: 65W)
7700X, DDR5-5200, Gunnir28
- GeForce RTX 3060 Ti, 200W
Unit: Percent Edit Full HD Benchmarks – Performance Rating Frametimes Inflowing Charts All None
- Full HD Benchmarks – Anno 1800: Frametimes (1% percentile)
- Full HD benchmarks – Cyberpunk 2077: Frametimes (1% percentile)
- Full HD benchmarks – Death Stranding DC: Frametimes (1st % percentile)
- Full HD benchmarks – Doom Eternal: Frame times (1% percentile)
- Full HD benchmarks – Dota 2: Frame times (1% percentile)
- Full HD benchmarks – F1 22: Frametimes (1% Percentile)
- Full HD Benchmarks – Guardians: Frametimes (1% Percentile)
- Full HD Benchmarks – SotTR: Frametimes (1% Percentile )
- Full HD benchmarks – Spider-Man: Frame times (1% percentile)
- Full HD benchmarks – The Witcher 3: Frame times (1% percentile)
-
- GeForce RTX 3060 Ti, 200W
7700X, DDR5-5200, FE99 - Radeon RX 6650 XT, 180W
7700X, DDR5-5200, PC Hellhound87
< li class="chart__row">GeForce RTX 3060, 170W
7700X, DDR5-5200, Asus TUF79 - GeForce RTX 3060 Ti, 200W
- Arc A770, 225W (GPU: 190W)
7700X, DDR5-5200, Limited69 - Arc A750, 225W (GPU: 190W)
7700X, DDR5-5200, Limited65 - GeForce RTX 3050, 130W
7700X, DDR5- 5200, Gigabyte Eagle58 - Arc A380, 75W (GPU: 65W)
7700X, DDR5-5200, Gunnir26
Unit: percent
Game benchmarks in HD (1280 × 720)
The benchmarks in HD (partly with FSR on “Performance”), which increasingly focus on the CPU, illustrate the problem that is already visible in Full HD: Depending on the game, Intel Arc or the driver have to struggle with an overhead , which sometimes lets the graphics cards fall behind the competition in terms of CPU limit. The problem isn't just limited to older APIs, such as Shadow of the Tomb Raider or F1 22 show (both DX12), while The Witcher 3 with DirectX 11 is once again the flagship for Arc.
HD benchmarks
- FPS performance rating
- Performance Rating Frametimes
Edit HD Benchmarks – Performance Rating FPS Inflowing Charts All None
- HD Benchmarks – Anno 1800: FPS< /li>
- HD Benchmarks – Cyberpunk 2077: FPS
- HD Benchmarks – Death Stranding DC: FPS
- HD Benchmarks – Doom Eternal: FPS
- HD Benchmarks – F1 22: FPS
- HD Benchmarks – Guardians: FPS
- HD Benchmarks – SotTR: FPS
- HD Benchmarks – Spider-Man: FPS
- HD Benchmarks – The Witcher 3: FPS
< li>HD Benchmarks – Dota 2: FPS
-
- GeForce RTX 3060 Ti, 200W
7700X , DDR5-5200, FE99 - Radeon RX 6650 XT, 180W
7700X, DDR5-5200, PC Hellhound86 - GeForce RTX 3060, 170W
7700X, DDR5-5200, Asus TUF83 - < strong>Arc A770, 225 W (GPU: 190 W)
7700X, DDR5-5200, Limited70 - Arc A750, 225 W (GPU: 190 W)
7700X, DDR5-5200, Limited67 - GeForce RTX 3050, 130 W
7700X, DDR5-5200, Gigabyte Eagle63 - Arc A380, 75W (GPU: 65W)
7700X, DDR5-5200, Gunnir32
- GeForce RTX 3060 Ti, 200W
Unit: Percent Edit HD Benchmarks – Performance Rating Frametimes Inflowing Charts All None
- HD Benchmarks – Anno 1800: Frametimes (1% percentile)
- HD Benchmarks – Cyberpunk 2077: Frametimes (1% percentile)
- HD Benchmarks – Death Stranding DC: Frametimes (1% percentile)
- HD Benchmarks – Doom Eternal: Frametimes (1% Percentile)
- HD Benchmarks – Dota 2: Frametimes (1% Percentile)
- HD Benchmarks – F1 22: Frametimes (1% Percentile)
- HD Benchmarks – Guardians: Frametimes (1% Percentile)
- HD Benchmarks – SotTR: Frametimes (1% Percentile )
- HD Benchmarks – Spider-Man: Frametimes (1% Percentile)
- HD Benchmarks – The Witcher 3: Frametimes (1% Percentile)
-
- GeForce RTX 3060 Ti, 200W
7700X, DDR5-5200, FE99 - Radeon RX 6650 XT, 180W
7700X, DDR5-5200, PC Hellhound85 - GeForce RTX 3060, 170W
7700X, DDR5 -5200, Asus TUF83 - Arc A770, 225W (GPU: 190W)
7700X, DDR5-5200, Limited68
< li class="chart__row">Arc A750, 225 W (GPU: 190 W)
7700X, DDR5-5200, Limited65 - GeForce RTX 3060 Ti, 200W
- GeForce RTX 3050 , 130W
7700X, DDR5-5200, Gigabyte Eagle63 - Arc A380, 75W (GPU: 65W)
7700X, DDR5-5200, Gunnir31
Unit: percent
Game benchmarks in DirectX 9 titles
The parcours used in the test includes titles with Vulkan, DirectX 12 and DirectX 11. Games with DirectX 10 and DirectX 9 are not included. This is not surprising, since these APIs have long been outdated and are no longer an issue in new releases. However, even DirectX 9 (the successor DirectX 10 appeared with Vista in 2006) is still not irrelevant and the relevance has a name: Counter-Strike – Global Offensive.
In this context, it was already known in August that Intel's Arc driver no longer supports DirectX 9.
Intel explained in a support document at the time that both the integrated GPUs of the Alder Lake processors (Core 12th Gen) and the discrete graphics cards of the Arc family “no longer natively support D3D9”. However, applications and games based on DirectX 9 could “continue to be run via the Microsoft D3D9On12 interface”.
D3D9On12 is open source software that translates the graphics commands from D3D9 to D3D12 and effectively acts as an alternative GPU driver. Compatibility is thus maintained in a roundabout way.
However, this costs performance – a lot in fact, as a look at Counter-Strike: Global Offensive shows (Map Dust II, maximum details, training without bots).
More than 240 FPS are not possible via the DirectX 9 DirectX 12 detour with Intel Arc, while the same CPU (Ryzen 7 7700X) runs to the CS:GO FPS limit of 400 FPS on graphics cards from Nvidia or AMD. The problem with the frame times is even more desolate: A maximum of 100 FPS with Intel Arc contrasts with a maximum of 300 FPS with Nvidia GeForce RTX and AMD Radeon RX – and the game also jerks noticeably again and again. Whether an Arc A770/A750 or an Arc A380 with less than a third of the shaders is used is practically irrelevant.
CS:GO
- HD benchmarks
- Full HD benchmarks
- WQHD benchmarks
HD Benchmarks – CS:GO
- FPS:
- GeForce RTX 3060 Ti, 200W
7700X, DDR5-5200, FE388.1 - GeForce RTX 3060, 170W
7700X, DDR5-5200, Asus TUF387.8 - GeForce RTX 3050, 130 W
7700X, DDR5-5200, Gigabyte Eagle386.6 - Radeon RX 6650 XT, 180W
7700X, DDR5-5200, PC Hellhound385.9 - Arc A770, 225W (GPU: 190W)
7700X, DDR5-5200, Limited237 ,0 - Arc A750, 225 W (GPU: 190 W)
7700X, DDR5-5200, Limited232.5 - Arc A380, 75W (GPU: 65W)
7700X, DDR5-5200, Gunnir222,9
- GeForce RTX 3060 Ti, 200W
- Frame times (1% percentile):
- GeForce RTX 3060, 170W
7700X, DDR5-5200, Asus TUF303,3 - GeForce RTX 3060 Ti, 200W
7700X, DDR5-5200, FE301,5 - GeForce RTX 3050, 130 W
7700X, DDR5-5200, Gigabyte Eagle294.4 - Radeon RX 6650 XT, 180 W
7700X, DDR5-5200, PC Hellhound294.0 - Arc A380, 75W (GPU: 65W)
7700X, DDR5-5200, Gunnir99.1 - Arc A770, 225W (GPU: 190W)
7700X, DDR5-5200, Limited99.0 - Arc A750, 225W (GPU: 190W)
7700X, DDR5-5200, Limited96.1
- GeForce RTX 3060, 170W
Unit: Frames Per Second (FPS) Full HD Benchmarks – CS:GO
- FPS:
- GeForce RTX 3060 Ti, 200W
7700X, DDR5-5200, FE388.4 - GeForce RTX 3060, 170W
7700X, DDR5-5200, Asus TUF387.3 - Radeon RX 6650 XT, 180W
7700X, DDR5-5200, PC Hellhound386.8 - GeForce RTX 3050, 130W
7700X , DDR5-5200, Gigabyte Eagle366,4 - Arc A770, 225 W (GPU: 190 W)
7700X, DDR5-5200, Limited232, 0 - Arc A750, 225W (GPU: 190W)
7700X, DDR5-5200, Limited230.9 - Arc A380, 75W (GPU: 65W)
7700X, DDR5-5200, Gunnir165.6
- GeForce RTX 3060 Ti, 200W
- Frame times (1% percentile):
- GeForce RTX 3060, 170 W
7700X, DDR5-5200, Asus TUF299.9 - GeForce RTX 3060 Ti, 200W
7700X, DDR5-5200, FE298.0 - Radeon RX 6650 XT, 180 W
7700X, DDR5-5200, PC Hellhound295.4 - GeForce RTX 3050, 130 W
7700X, DDR5-5200, Gigabyte Eagle243,2 - Arc A750, 225W (GPU: 190W)
7700X, DDR5-5200, Limited97,1 - Arc A380, 75W (GPU: 65W)
7700X, DDR5-5200, Gunnir94.0 - Arc A770, 225W (GPU: 190W)< br>7700X, DDR5-5200, Limited93.1
- GeForce RTX 3060, 170 W
Unit: frames per second (FPS) WQHD benchmarks – CS:GO
- FPS:
- GeForce RTX 3060 Ti, 200W
7700X, DDR5-5200, FE386.3 - Radeon RX 6650 XT, 180W
7700X, DDR5-5200, PC Hellhound384, 0 - GeForce RTX 3060, 170W
7700X, DDR5-5200, Asus TUF373,6 - GeForce RTX 3050, 130W
7700X, DDR5-5200, Gigabyte Eagle259.4 - Arc A770, 225 W (GPU: 190 W)
7700X, DDR5- 5200, Limited235.0 - Arc A750, 225 W (GPU: 190 W)
7700X, DDR5-5200, Limited222.5
- GeForce RTX 3060 Ti, 200W
- Frame times (1 % Percentile):
- GeForce RTX 3060 Ti, 200W
7700X, DDR5-5200, FE301,1 - Radeon RX 6650 XT, 180 W
7700X, DDR5-5200, PC Hellhound250,4 - GeForce RTX 3060, 170 W
7700X, DDR5-5200, Asus TUF235.5 - GeForce RTX 3050, 130W
7700X, DDR5-5200, Gigabyte Eagle186.1 - Arc A770, 225W (GPU: 190W)
7700X, DDR5-5200, Limited109.4 - Arc A750, 225W (GPU: 190W)
7700X, DDR5-5200, Limited94.9
- GeForce RTX 3060 Ti, 200W
Unit: Images per Second (FPS)
Full HD presents almost the same picture, except that in this case the A380 also drops feathers in FPS. But the competition remains miles ahead with 390/300 FPS vs. 240/100 FPS.
Interim conclusion gaming performance
How the Intel Arc A770 and A750 compare to the GeForce RTX 3060 or Radeon RX 6650 XT depends on several factors:
- The game.
- The API used.
- The resolution (or GPU/CPU limit).
The heavier the load on the GPU, the better Arc can position itself. In turn, the more the CPU is in demand, the further Arc is behind.
Only in WQHD does the Arc A770 win the FPS course over the GeForce RTX 3060, in However, both models lag behind on average in lower resolutions or, in principle, in terms of frame times. The GeForce RTX 3060 Ti remains unmatched with the exception of The Witcher 3.
The course does not show that Arc performs much better in games with current APIs than in older ones (DirectX 10 and 11): The Witcher 3 with DirectX 11 obviously suits Arc very well, while DirectX 12 titles like F1 22 and Shadow of the Tomb Raider (in CPU limit) cause problems. The performance in the DirectX 9 shooter CS:GO is desolate.
App benchmarks
GPUs can do more than games, they can take over CPU tasks such as video editing or rendering via the shaders – provided they are controlled accordingly (CUDA, OpenCL etc.) – or they can efficiently and quickly “in hardware” produce videos via the integrated video decoder and encoder. de- and encode.
Intel Arc already presented itself comparatively strong in this area – not only, but also because the Alchemist architecture is the first ever, the AV1 can encode in hardware. Arc A770 and Arc A750 are no exception.
With AV1 encoding in HandBrake, the two Arc graphics cards do their rounds alone in this test and overshadow even the strongest CPU with software encoding. If the H.265 codec is selected instead of AV1, which other GPUs can also handle, Arc is also in the lead.
Charts
- HandBrake Nightly (2022090501) – 2160p60 H.264 to 2160p60 AV1
- HandBrake Nightly (2022090501) – 2160p60 H.264 to 2160p60 H.265
8 entries HandBrake Nightly (2022090501) – 2160p60 H.264 to 2160p60 AV1
- Hardware (GPU):
- Intel Arc A380
Ryzen 7 7700X, DDR5-52001:17 - Intel Arc A770 Ltd.Ryzen 7 7700X, DDR5-52001:18
- Intel Arc A750 Ltd.
Ryzen 7 7700X, DDR5-52001:18
< li class="chart__row">Medion Erazer Major X10
Core i7-12700H, Arc A730M, Turbo1:56 - Intel Arc A380
- AMD Ryzen 7 7950X, 5200CL32
230 watts, iGPU, DDR5-520020:00 - Intel Core i9- 12900K
241W, UHD 770, DDR5-4800CL3823:51 - AMD Ryzen 9 5950X, 3200CL14
142 W, w/o iGPU, DDR4-320025:45 - Intel Core i7-12700K
190 W, UHD 770, DDR5- 4800CL3828:24 - AMD Ryzen 9 5900X, 3200CL14
142W, w/o iGPU, DDR4-320031:16< /li> - AMD Ryzen 7 7700X, 5200CL32
142 watts, iGPU, DDR5-520034:26 - Intel Core i5-12600K
150W, UHD 770, DDR5-4800CL3836:32 - AMD Ryzen 7 5800X, 3200CL14
142W, w/o iGPU, DDR4-320042:45 - AMD Ryzen 7 5800X3D , 3200CL14
142W, w/o iGPU, DDR4-320044:28 - AMD Ryzen 7 5700X, 3200CL14
76 W, w/o iGPU, DDR4-320047:32 - Intel Core i5-12500
117 W, UHD 770, DDR5-4800CL3849:17
< li class="chart__row">Medion Erazer Major X10
Core i7-12700H, Arc A730M, Turbo50:11
Ryzen 9 5900HX, RX 6800M, Turbo51:33
Ryzen 9 6900HS, RX 6800S, Turbo53:31< /li>
76W, w/o iGPU, DDR4-320057:57
< li class="chart__row">Lenovo Yoga Slim 9i (2022)
Core i7-1280P, Iris Xe, Performance58:41
182W, iGPU, DDR4-266665:54
142 W, w/o iGPU , DDR4-293368:15
Ryzen 7 6800U, 680M, Performance69:56
Ryzen 7 4800U, Vega8, DDR4…75:59
Ryzen 5 6650U Pro, 660M, Performance87:12
Unit: Minutes, Seconds 15 entries HandBrake Nightly (2022090501) – 2160p60 H.264 to 2160p60 H.265
- GPU:
- Intel Arc A380
Ryzen 7 7700X, DDR5-52001:12 - Intel Arc A770 Ltd.
Ryzen 7 7700X , DDR5-52001:13 - Intel Arc A750 Ltd.
Ryzen 7 7700X, DDR5-52001:13 - Asus ROG Zephyrus G14 (2022)
Ryzen 9 6900HS, RX 6800S, Turbo1:25 - AMD Radeon RX 6650 XT
Ryzen 7 7700X, DDR5-52001:25 - Intel Core i7-12700K
190W, UHD 770, DDR5-4800CL381:36 - Asus ROG Zephyrus G14 (2022), iGPU
Ryzen 9 6900HS, 680M, Turbo1:36 - Intel Core i5-12600K
150 W, UHD 770, DDR5-4800CL381:38 - Intel Core i5-12500
117 W, UHD 770, DDR5-4800CL381:38 - AMD Ryzen 7 7950X, 5200CL32
230 Watt, iGPU, DDR5-52001 :38 - Nvidia GeForce RTX 3070
Ryzen 7 7700X, DDR5-52001:39 - Nvidia GeForce RTX 3060 Ti
Ryzen 7 7700X, DDR5-52001:40 - Nvidia GeForce RTX 3060
Ryzen 7 7700X, DDR5-52001:42 - Nvidia GeForce RTX 3080 Ti
Ryzen 7 7700X, DDR5-52001:43 - Nvidia GeForce RTX 3080
Ryzen 7 7700X, DDR5-52001:43 - Nvidia GeForce RTX 3050
Ryzen 7 7700X, DDR5-52001:45 - Asus Zenbook 13S (2022)
Ryzen 7 6800U, 680M, performance1:47 - Lenovo ThinkPad Z13 G1
Ryzen 5 6650U Pro, 660M, Performance1:48 - Lenovo Yoga Slim 9i (2022)
Core i7-1280P, Iris Xe, Performance1:48 - Medion Erazer Major X10
Core i7-12700H, Arc A730M, Turbo1:49 - Medion Erazer Major X10, iGPU
Core i7-12700H, Iris Xe, Turbo1:49 - Asus ROG Strix G15 (2021)
Ryzen 9 5900HX, RX 6800M, Turbo1:52 - Lenovo Yoga Slim 7
Ryzen 7 4800U, Vega8, DDR4…2:14 - Asus ROG Strix G15 (2021), iGPU
Ryzen 9 5900HX, Vega8, Turbo2:16 - AMD Ryzen 7 7700X, 5200CL32
142 watts, iGPU, DDR5-52004:19 - Intel Core i9-12900K
241 W, UHD 770, DDR5-4800CL384:39
- Intel Arc A380
- Software:
- AMD Ryzen 7 7950X, 5200CL32
230 Watts, iGPU, DDR5-52003:03 - AMD Ryzen 9 5950X, 3200CL14
142 W , w/o iGPU, DDR4-32004:20 - Intel Core i9-12900K
241 W, UHD 770, DDR5-4800CL384:57 - AMD Ryzen 7 7700X, 5200CL32
142 watts, iGPU, DDR5-52005:15 - AMD Ryzen 9 5900X, 3200CL14
142W, w/o iGPU, DDR4-32005:17 - Intel Core i7-12700K
190W, UHD 770, DDR5-4800CL385:20 - Intel Core i5-12600K
150W, UHD 770, DDR5-4800CL386:45 - AMD Ryzen 7 5800X, 3200CL14
142 W, w/o iGPU, DDR4-32006:50 - AMD Ryzen 7 5800X3D, 3200CL14
142 W, w/o iGPU, DDR4-32007:06 - AMD Ryzen 7 5700X, 3200CL14
76 W, w/o iGPU, DDR4-32007:42 - Asus ROG Strix G15 (2021)
Ryzen 9 5900HX , RX 6800M, Turbo8:32 - Asus ROG Zephyrus G14 (2022)
Ryzen 9 6900HS, RX 6800S, Turbo8: 34 - Intel Core i5-12500
117W, UHD 770, DDR5-4800CL388:48 - AMD Ryzen 5 5600X, 3200CL14
76 W, w/o iGPU, DDR4-32009:09 - Medion Erazer Major X10
Core i7-12700H, Arc A730M, Turbo9:30 - Lenovo Yoga Slim 9i (2022)
Core i7-1280P, Iris Xe, Performance11:13 - Asus Zenbook 13S (2022)
Ryzen 7 6800U, 680M, Performance11:30 - Intel Core i5-10600K
182 W, iGPU, DDR4-266611:38 - Lenovo Yoga Slim 7
Ryzen 7 4800U, Vega8, DDR4…12:43 - AMD Ryzen 7 2700X
142 W, w/o iGPU , DDR4-293312:57
li>
< li class="chart__row">Lenovo ThinkPad Z13 G1
Ryzen 5 6650U Pro, 660M, performance12:58 - AMD Ryzen 7 7950X, 5200CL32
Unit: minutes, seconds
Intel Arc is also strong in Adobe Premiere Pro when it comes to exporting a video (source 4K60 and 8K30) in MP4 (H.265) format, which includes transitions, slow-motion effects and color grading. In this case, both graphics cards draw level with the GeForce RTX 3060. Intel Arc is a little further behind in creating a 3D model based on 87 photos of the same object. Intel Arc is again far behind in the Blender benchmark, which has also supported Intel Arc in principle since version 3.0.0. But Arc doesn't stand a chance against the GeForce RTX 3060.
Charts
- Adobe Premiere Pro 22.5
- Agisoft Metashape 1.8.4
- Blender Benchmark 3.2 .1
16 entries Adobe Premiere Pro 22.5
- 4K60/8K24 + Effects/Color Grading to 4K60 H.265 (Hardware):
- Nvidia GeForce RTX 3080
Ryzen 7 7700X, DDR5-52000:55 - Nvidia GeForce RTX 3080 Ti
Ryzen 7 7700X, DDR5-52000:56 - Nvidia GeForce RTX 3060 Ti
Ryzen 7 7700X, DDR5 -52001:00 - Nvidia GeForce RTX 3070
Ryzen 7 7700X, DDR5-52001:01 - Nvidia GeForce RTX 3060
Ryzen 7 7700X, DDR5-52001:07 - Intel Arc A770 Ltd.
Ryzen 7 7700X, DDR5-52001:10 - Intel Arc A750 Ltd.
Ryzen 7 7700X, DDR5-52001:10 - Medion Erazer Major X10
Core i7-12700H, Arc A730M, Turbo1:19 - AMD Radeon RX 6650 XT
Ryzen 7 7700X, DDR5-52001:21 - Nvidia GeForce RTX 3050
Ryzen 7 7700X, DDR5-52001:29 - Asus ROG Zephyrus G14 (2022)
Ryzen 9 6900HS, RX 6800S, Turbo1:45 - Asus ROG Strix G15 (2021)
Ryzen 9 5900HX, RX 6800M, Turbo1:46 - Intel Arc A380
Ryzen 7 7700X, DDR5 -52002:23 - Asus ROG Zephyrus G14 (2022), iGPU
Ryzen 9 6900HS, 680M, Turbo3:44< /li> - Lenovo Yoga Slim 9i (2022)
Core i7-1280P, Iris Xe, Performance3:52 - Medion Erazer Major X10, iGPU
Core i7-12700H, Iris Xe, Turbo4:11 - Lenovo ThinkPad Z13 G1
Ryzen 5 6650U Pro, 660M, Performance4:48 - Asus Zenbook 13S (2022)
Ryzen 7 6800U, 680M, performance5:01 - Lenovo Yoga Slim 7
Ryzen 7 4800U, Vega8, DDR4…5:57 - AMD Ryzen 7 7950X, 5200CL32
230 Watt, iGPU, DDR5-52006:00 - AMD Ryzen 7 7700X, 5200CL32
142 Watt, iGPU, DDR5-52006:10 - Intel Core i9-12900K
241 W, UHD 770, DDR5-4800CL386:37 - Intel Core i7-12700K
190W, UHD 770, DDR5-4800CL386:38 - Intel Core i5-12500
117W, UHD 770, DDR5-4800CL386:54 - Intel Core i5-12600K
150W, UHD 770, DDR5-4800CL387:11 - Asus ROG Strix G15 (2021), iGPU
Ryzen 9 5900HX, Vega8, Turbo7:11
- Nvidia GeForce RTX 3080
- 4K60/8K24 + Effects/Color Grading to 4K60 H.265 (Software):
- Intel Core i9-12900K
241W, UHD 770, DDR5-4800CL383:02 - Intel Core i7-12700K
190 W, UHD 770, DDR5-4800CL383:22 - AMD Ryzen 7 7700X, 5200CL32
142 Watt, iGPU, DDR5-52003:51
< li class="chart__row">Intel Core i5-12600K
150 W, UHD 770, DDR5-4800CL383:55 - Intel Core i9-12900K
- AMD Ryzen 7 7950X, 5200CL32
230 Watt, iGPU, DDR5-52004:18 - AMD Ryzen 7 5800X3D, 3200CL14
142 W, w/o iGPU, DDR4-32004:43 - AMD Ryzen 9 5900X, 3200CL14
142 W, w/o iGPU, DDR4-32004:56 - Intel Core i5- 12500
117W, UHD 770, DDR5-4800CL385:07 - AMD Ryzen 7 5800X, 3200CL14
142W, w/o iGPU, DDR4-32005:08 - AMD Ryzen 7 5700X , 3200CL14
76 W, w/o iGPU, DDR4-32005:21 - Medion Erazer Major X10
Core i7-12700H, Arc A730M, Turbo5:22 - AMD Ryzen 9 5950X, 3200CL14
142 W, w/o iGPU, DDR4-32005:32 - AMD Ryzen 5 5600X, 3200CL14
76 W, w/o iGPU, DDR4-32005:45 - Asus ROG Zephyrus G14 (2022)
Ryzen 9 6900HS, RX 6800S, Turbo5:45 - AMD Ryzen 5 5600, 3200CL14
76 W, w/o iGPU, DDR4-32005:48 - Lenovo Yoga Slim 9i (2022)
Core i7-1280P, Iris Xe, Performance6:09 - Intel Core i5-10600K
182W, iGPU, DDR4-26667:35< /li> - Asus Zenbook 13S (2022)
Ryzen 7 6800U, 680M, performance7:59 - Lenovo ThinkPad Z13 G1
Ryzen 5 6650U Pro, 660M, performance8:25 - AMD Ryzen 7 2700X
142 W, w/o iGPU , DDR4-29339:01 - Asus ROG Strix G15 (2021)
Ryzen 9 5900HX, RX 6800M, Turbo9:21 - Lenovo Yoga Slim 7
Ryzen 7 4800U, Vega8, DDR4…9:48
li>
Unit: minutes, seconds 15 entries Agisoft Metashape 1.8.4
- Hardware (GPU):
- Nvidia GeForce RTX 3080 Ti< br>Ryzen 7 7700X, DDR5-52000:35
- Nvidia GeForce RTX 3080
Ryzen 7 7700X, DDR5-52000:37 - Nvidia GeForce RTX 3070
Ryzen 7 7700X, DDR5-52000:42 - Nvidia GeForce RTX 3060 Ti
Ryzen 7 7700X, DDR5-52000:46 - Nvidia GeForce RTX 3060
Ryzen 7 7700X, DDR5- 52000:53 - AMD Radeon RX 6650 XT
Ryzen 7 7700X, DDR5-52000:55 - Intel Arc A770 Ltd.
Ryzen 7 7700X, DDR5-52001:02 - Intel Arc A750 Ltd.
Ryzen 7 7700X, DDR5 -52001:05 - Nvidia GeForce RTX 3050
Ryzen 7 7700X, DDR5-52001:08 - Asus ROG Strix G15 (2021)
Ryzen 9 5900HX, RX 6800M, Turbo1:12 - Asus ROG Zephyrus G14 (2022)
Ryzen 9 6900HS, RX 6800S, Turbo1:25 - Medion Erazer Major X10
Core i7-12700H, Arc A730M, Turbo1:30 - Asus ROG Zephyrus G14 (2022), iGPU
Ryzen 9 6900HS, 680M, Turbo2:32 - Intel Arc A380
Ryzen 7 7700X, DDR5-52002:34 - Asus Zenbook 13S (2022)
Ryzen 7 6800U, 680M, performance3:27 - Asus ROG Strix G15 (2021), iGPU
Ryzen 9 5900HX, Vega8, Turbo4:31 - Lenovo ThinkPad Z13 G1
Ryzen 5 6650U Pro, 660M, Performance4:56 - Lenovo Yoga Slim 7
Ryzen 7 4800U, Vega8, DDR4…5:16 - Lenovo Yoga Slim 9i (2022)
Core i7-1280P, Iris Xe, Performance 6:27 - Medion Erazer Major X10, iGPU
Core i7-12700H, Iris Xe, Turbo6:37 - AMD Ryzen 7 7700X, 5200CL32
142 watts, iGPU, DDR5-52009:01 - AMD Ryzen 7 7950X, 5200CL32
230 watts, iGPU, DDR5-52009:05 - Intel Core i9-12900K
241 W, UHD 770, DDR5-4800CL3815:28 - Intel Core i7-12700K
190 W, UHD 770, DDR5-4800CL3815:55 - Intel Core i5-12500
117 W, UHD 770, DDR5- 4800CL3816:36 - Intel Core i5-12600K
150W, UHD 770, DDR5-4800CL3817:06
li>
- Software (CPU):
- AMD Ryzen 7 7700X, 5200CL32
142 watts, iGPU, DDR5-52003:02 - AMD Ryzen 7 7950X, 5200CL32
230 watts, iGPU, DDR5-52003:05 - Intel Core i9-12900K
241W, UHD 770, DDR5-4800CL383:35 - Intel Core i7-12700K
190 W, UHD 770, DDR5-4800CL383:47 - AMD Ryzen 7 5800X, 3200CL14
142 W, w/o iGPU, DDR4-32003:55 - AMD Ryzen 9 5900X, 3200CL14
142 W, w/o iGPU, DDR4-32004:02 - AMD Ryzen 9 5950X, 3200CL14
142 W, w/o iGPU, DDR4-32004:04 - Intel Core i5-12600K
150W, UHD 770, DDR5-4800CL384:05 - AMD Ryzen 7 5800X3D, 3200CL14
142W, w/o iGPU, DDR4-32004:07 - AMD Ryzen 7 5700X, 3200CL14
76W, w/o iGPU, DDR4-32004:11 - Asus ROG Zephyrus G14 (2022)
Ryzen 9 6900HS, RX 6800S, Turbo4:13 - AMD Ryzen 5 5600X, 3200CL14
76 W, w/o iGPU, DDR4-32004:21 - Asus ROG Strix G15 (2021)
Ryzen 9 5900HX, RX 6800M, Turbo4:28 - Intel Core i5-12500
117W, UHD 770, DDR5-4800CL384:37 - Medion Erazer Major X10
Core i7-12700H, Arc A730M, Turbo4:55 - Lenovo ThinkPad Z13 G1
Ryzen 5 6650U Pro, 660M, performance5:11 - Intel Core i5-10600K
182W, iGPU, DDR4-26665:32 - Asus Zenbook 13S (2022)
Ryzen 7 6800U, 680M, Performance5:41 - AMD Ryzen 7 2700X
142 W, w/o iGPU , DDR4-29335: 50 - Lenovo Yoga Slim 7
Ryzen 7 4800U, Vega8, DDR4…5:50 - Lenovo Yoga Slim 9i (2022)
Core i7-1280P, Iris Xe, performance 6:23
- AMD Ryzen 7 7700X, 5200CL32
Unit: minutes, seconds 12 entries Blender Benchmark 3.2. 1
- Hardware rendering (GPU):
- Nvidia GeForce RTX 3080 Ti
Ryzen 7 7700X, DDR5-52005,776.30 - Nvidia GeForce RTX 3080
Ryzen 7 7700X, DDR5-52004,978.00 - Nvidia GeForce RTX 3070
Ryzen 7 7700X, DDR5-52003,672 ,00 - Nvidia GeForce RTX 3060 Ti
Ryzen 7 7700X, DDR5-52003,242.00 - Nvidia GeForce RTX 3060
Ryzen 7 7700X, DDR5-52002.508.34 - Intel Arc A770 Ltd.
Ryzen 7 7700X, DDR5-52001.656.003.3.0 - Nvidia GeForce RTX 3050
Ryzen 7 7700X, DDR5-52001,624.30 - Intel Arc A750 Ltd.
Ryzen 7 7700X, DDR5-52001,607,473.3.0 - Asus ROG Strix G15 (2021)
Ryzen 9 5900HX, RX 6800M, Turbo1,399.54 - AMD Radeon RX 6650 XT
Ryzen 7 7700X, DDR5-52001.103.90 - Asus ROG Zephyrus G14 (2022)
Ryzen 9 6900HS, RX 6800S, Turbo1,077.20 - Medion Erazer Major X10
Core i7-12700H, Arc A730M, Turbo982.85 - Asus ROG Zephyrus G14 (2022), iGPU
Ryzen 9 6900HS, 680M, Turbo262.53 - Lenovo ThinkPad Z13 G1
Ryzen 5 6650U Pro, 660M, Performance140.13 - Intel Arc A380
Ryzen 7 7700X, DDR5-52000.00Crash
- Nvidia GeForce RTX 3080 Ti
- Software rendering (CPU):
- AMD Ryzen 7 7950X, 5200CL32
230 watts, iGPU, DDR5-5200593.67 - AMD Ryzen 9 5950X, 3200CL14
142 W, w/o iGPU, DDR4-3200409,26 - Intel Core i9-12900K
241 W , UHD 770, DDR5-4800CL38371.36 - AMD Ryzen 9 5900X, 3200CL14
142 W, w/o iGPU, DDR4-3200327.46 - Intel Core i7-12700K
190 W, UHD 770, DDR5-4800CL38312.06 - AMD Ryzen 7 7700X, 5200CL32
142 Watt, iGPU, DDR5 -5200304.40 - AMD Ryzen 7 5800X, 3200CL14
142 W, w/o iGPU, DDR4-3200232.81 - Intel Core i5-12600K
150W, UHD 770, DDR5-4800CL38232.74 - AMD Ryzen 7 5800X3D, 3200CL14
142 W, w/o iGPU, DDR4-3200221.91 - AMD Ryzen 7 5700X, 3200CL14
76 W, w/o iGPU, DDR4-3200221,05 - Medion Erazer Major X10
Core i7-12700H, Arc A730M, Turbo213.87 - Asus ROG Strix G15 (2021)< br>Ryzen 9 5900HX, RX 6800M, Turbo199.64
- Asus ROG Zephyrus G14 (2022)
Ryzen 9 6900HS, RX 6800S, Turbo191.20 - Intel Core i5-12500
117 W, UHD 770, DDR5-4800CL38173.65 - Lenovo Yoga Slim 9i (2022)
Core i7-1280P, Iris Xe , Performance171.54 - AMD Ryzen 5 5600X, 3200CL14
76W, w/o iGPU, DDR4-3200169.58 - AMD Ryzen 7 2700X
142W, w/o iGPU , DDR4-2933163.53 - Asus Zenbook 13S (2022)
Ryzen 7 6800U, 680M, performance147.92 - Lenovo Yoga Slim 7
Ryzen 7 4800U, Vega8, DDR4…139.80 - Intel Core i5-10600K< br>182W, iGPU, DDR4-2666138.64
- Lenovo ThinkPad Z13 G1
Ryzen 5 6650U Pro, 660M, Performance137.29
< /li>
- AMD Ryzen 7 7950X, 5200CL32
Unit: Points
Power consumption
What Intel Arc A770 and Arc A750 are able to do, has been comprehensively outlined. The question arises as to what electrical power both graphics cards need to consume.
Power consumption under load and when idling
190 watts of GPU power consumption and its confirmation in the telemetry data from HWiNFO already indicated the direction that the measurement of the total power consumption of the graphics cards will take. At just over 230 watts, the Arc A770 in Doom Eternal is slightly above and the Arc A750 at 220 watts is slightly below the official TDP. The GeForce RTX 3060, which is comparably fast in this game, has 170 watts. So far, so expected.
Power consumption while gaming
- Doom Eternal, 3840 × 2160
- Doom Eternal, 2560 × 1440
- Doom Eternal, 1920 × 1080
Gaming power consumption – Doom Eternal, 3840 × 2160
- Max FPS:
- Nvidia GeForce GTX 1060109
- AMD Radeon RX 6600 XT145
- Nvidia GeForce RTX 2060159
- AMD Radeon RX 5600 XT164
- Nvidia GeForce RTX 3060173
- AMD Radeon RX 6650 XT176
- Nvidia GeForce GTX 1080179
- AMD Radeon RX 580200
- Nvidia GeForce RTX 3060 Ti203
- Intel Arc A750 Limited Edition213
- AMD Radeon RX 5700 XT213
- AMD Radeon RX 6700 XT215
- Nvidia GeForce RTX 3070217
- AMD Radeon RX 6750 XT220
- Nvidia GeForce RTX 2070 Super227
- AMD Radeon RX 6800229
- Intel Arc A770 Limited Edition232
- Intel Arc A750 Limited Edition max.233
- Intel Arc A770 Limited Edition max.290
- AMD Radeon RX 6800 XT294
- AMD Radeon RX 6900 XT296
- AMD Radeon RX Vega 64299
- Nvidia GeForce RTX 3080322
- AMD Radeon RX 6950 XT344
- Nvidia GeForce RTX 3080 12 GB357
- Nvidia GeForce RTX 3080 Ti362
- Sapphire RX 6950 XT Nitro+ Pure372
- XFX Radeon RX 6900 XT XTXH375
- Asus GeForce RTX 3090 Strix OC392
- Nvidia GeForce RTX 3090 Ti463
li>
Unit: Watt (W) Gaming power consumption – Doom Eternal, 2560 × 1440
- Max FPS:
- Nvidia GeForce GTX 1060107
- AMD Radeon RX 6600135
- AMD Radeon RX 6600 XT148
- AMD Radeon RX 5600 XT156
- Nvidia GeForce RTX 2060159
- Nvidia GeForce RTX 3060173
- AMD Radeon RX 6650 XT176
- Nvidia GeForce GTX 1080178
- AMD Radeon RX 580189
- Nvidia GeForce RTX 3060 Ti203
- AMD Radeon RX 5700 XT213
- Nvidia GeForce RTX 2070 Super216
- AMD Radeon RX 6700 XT217
- Nvidia GeForce RTX 3070217
- AMD Radeon RX 6800220
- Intel Arc A750 Limited Edition220
- AMD Radeon RX 6750 XT222
- Intel Arc A770 Limited Edition232
- AMD Radeon RX 6800 XT295
- AMD Radeon RX 6900 XT296
- AMD Radeon RX Vega 64298
- Nvidia GeForce RTX 3080319
- AMD Radeon RX 6950 XT344
- Nvidia GeForce RTX 3080 12 GB354
- Nvidia GeForce RTX 3080 Ti359
- Sapphire RX 6950 XT Nitro+ Pure374
- XFX Radeon RX 6900 XT XTXH375
- Asus GeForce RTX 3090 Strix OC392
- Nvidia GeForce RTX 3090 Ti428
- Max FPS: < ul class="chart__group-body">
- Nvidia GeForce GTX 1060104
- Nvidia GeForce RTX 3050129
- AMD Radeon RX 6600135
- AMD Radeon RX 5600 XT148
- AMD Radeon RX 6600 XT148
- Nvidia GeForce RTX 2060159
- Nvidia GeForce RTX 3060173
- AMD Radeon RX 6650 XT176
- AMD Radeon RX 580179
- Nvidia GeForce GTX 1080179
- Nvidia GeForce RTX 3060 Ti203
- AMD Radeon RX 6800206
- Nvidia GeForce RTX 2070 Super206
- AMD Radeon RX 5700 XT212
- Nvidia GeForce RTX 3070217
- AMD Radeon RX 6700 XT218
- Intel Arc A750 Limited Edition222
- AMD Radeon RX 6750 XT223
- Intel Arc A770 Limited Edition230
- AMD Radeon RX 6800 XT294
- AMD Radeon RX 6900 XT296
- AMD Radeon RX Vega 64299
- Nvidia GeForce RTX 3080316
- AMD Radeon RX 6950 XT344
- Nvidia GeForce RTX 3080 12GB353
- Nvidia GeForce RTX 3080 Ti358
- XFX Radeon RX 6900 XT XTXH372
- Sapphire RX 6950 XT Nitro+ Pure375
- Nvidia GeForce RTX 3090 Ti387
- Asus GeForce RTX 3090 Strix OC392
Unit: Watt (W)
A real surprise in the test was again the consumption of the two graphics cards on the Windows desktop: Intel Arc A750 and Intel Arc A770 consume 41 and 47 watts respectively in this mode, where more than 10 watts are now considered comparatively high. Intel confirmed the readings by the editors.
The high basic consumption also catches up with the Arc graphics cards in SDR playback on YouTube. Intel Arc, on the other hand, reproduces the same video in HDR comparatively efficiently, because the competition – especially Nvidia – has even more to nibble on in this operating mode.
Power consumption, Windows desktop
- Complete idle
- YouTube video
- 3840 × 2160, 60 Hz:
- AMD Radeon RX 66005
- AMD Radeon RX 6600 XT5
- AMD Radeon RX 6650 XT5
- AMD Radeon RX 6700 XT7
- Nvidia GeForce GTX 10607
- AMD Radeon RX 6750 XT8
- AMD Radeon RX 68008
- AMD Radeon RX 6800 XT8
- XFX Radeon RX 6900 XT XTXH8
- AMD Radeon RX 5600 XT9
- AMD Radeon RX 6900 XT9
- Nvidia GeForce GTX 10809
- AMD Radeon RX 6950 XT10
- Sapphire RX 6950 XT Nitro+ Pure10
- Nvidia GeForce RTX 305010
- Nvidia GeForce RTX 206011
- Nvidia GeForce RTX 2070 Super11
- Nvidia GeForce RTX 306011
- Nvidia GeForce RTX 3060 Ti11
- Nvidia GeForce RTX 307011
- AMD Radeon RX 5700 XT12
- Nvidia GeForce RTX 308012
- AMD Radeon RX Vega 6413
- Nvidia GeForce RTX 3080 Ti13
- Nvidia GeForce RTX 3080 12GB14
- Asus GeForce RTX 3090 Strix OC15
- AMD Radeon RX 58016
- Nvidia GeForce RTX 3090 Ti25
- Intel Arc A750 Limited Edition41
- Intel Arc A770 Limited Edition47
- Dual monitor, 2 × 3840 × 2160, 60 Hz:
- Nvidia GeForce RTX 305013
- AMD Radeon RX Vega 6415
- Nvidia GeForce RTX 306019
- Nvidia GeForce RTX 3060 Ti20
- Nvidia GeForce RTX 307021
- AMD Radeon RX 6600 XT22
- AMD Radeon RX 660023
- Nvidia GeForce RTX 308023
< li class="chart__row">AMD Radeon RX 6650 XT24
- Nvidia GeForce RTX 3080 Ti24
- Nvidia GeForce GTX 106026
- Asus GeForce RTX 3090 Strix OC27
- AMD Radeon RX 5600 XT29
- AMD Radeon RX 6700 XT33
- Nvidia GeForce RTX 2070 Super34
- Nvidia GeForce RTX 206035
- Nvidia GeForce RTX 3090 Ti35
- Nvidia GeForce GTX 108037
- AMD Radeon RX 6750 XT39
- AMD Radeon RX 6900 XT39
- AMD Radeon RX 5700 XT40
- XFX Radeon RX 6900 XT XTXH40
- AMD Radeon RX 680041
- AMD Radeon RX 6800 XT41
- AMD Radeon RX 58042
- Intel Arc A770 Limited Edition48
- AMD Radeon RX 6950 XT50
- Sapphire RX 6950 XT Nitro+ Pure50
< /ul> Power consumption, Windows desktop – completely idle
< li class="chart__row">Nvidia GeForce RTX 3080 12GB26
li>
li>
< li class="chart__row">Intel Arc A750 Limited Edition42
Unit: Watt (W) Power Consumption, Windows Desktop – YouTube Video
- 3840 × 2160, 60 FPS:
- AMD Radeon RX 6600 XT15
- Nvidia GeForce RTX 305015
- AMD Radeon RX 6650 XT17
- AMD Radeon RX 6700 XT18
- Nvidia GeForce RTX 2070 Super19
- Nvidia GeForce RTX 306019
- Nvidia GeForce RTX 307019
- AMD Radeon RX 660020
- Nvidia GeForce RTX 206020
- AMD Radeon RX 6750 XT22
< li class="chart__row">Nvidia GeForce RTX 3060 Ti23
- Nvidia GeForce GTX 108024
- Nvidia GeForce GTX 106025
- AMD Radeon RX 5600 XT30
- AMD Radeon RX 6900 XT30
- Nvidia GeForce RTX 308030
- AMD Radeon RX 5700 XT32
- AMD Radeon RX 6800 XT32
- AMD Radeon RX 680033
- XFX Radeon RX 6900 XT XTXH34
- Nvidia GeForce RTX 3080 Ti34
- AMD Radeon RX 6950 XT36
- Sapphire RX 6950 XT Nitro+ Pure36
- Nvidia GeForce RTX 3080 12GB36
- Nvidia GeForce RTX 3090 Ti36
- Asus GeForce RTX 3090 Strix OC37
- Intel Arc A750 Limited Edition45
- Intel Arc A770 Limited Edition53
- Nvidia GeForce RTX 305028
- AMD Radeon RX 660030
- AMD Radeon RX 6600 XT31
- AMD Radeon RX 6650 XT32
- Nvidia GeForce RTX 2070 Super35
- Nvidia GeForce RTX 306036
- Nvidia GeForce RTX 307038
- Nvidia GeForce RTX 206039
- Nvidia GeForce RTX 3060 Ti40
- AMD Radeon RX 5600 XT43
- Nvidia GeForce GTX 106043
- AMD Radeon RX 5700 XT45
- AMD Radeon RX 6700 XT45
- AMD Radeon RX 6750 XT47
- Intel Arc A750 Limited Edition50
- Intel Arc A770 Limited Edition57
- AMD Radeon RX 680060
- AMD Radeon RX 6800 XT61
- AMD Radeon RX 6900 XT61
- XFX Radeon RX 6900 XT XTXH61
- AMD Radeon RX 6950 XT63
- Sapphire RX 6950 XT Nitro+ Pure63
- Nvidia GeForce RTX 308066< /li>
- Nvidia GeForce RTX 3090 Ti68
- Nvidia GeForce GTX 108076
- Nvidia GeForce RTX 3080 Ti81
- Nvidia GeForce RTX 3080 12GB82
- Asus GeForce RTX 3090 Strix OC87
li>
Unit: Watts (W)
Performance losses at lower TDP
To what extent Intel Arc A770 and Arc A750 also need the comparatively high power consumption in games in order to reach the level shown, ComputerBase has looked in detail in Doom Eternal (WQHD). For the test, the GPU power in the driver on the Arc A770 was varied in 10-watt increments from 100 watts (95 watts is the minimum allowed) to the maximum (228 watts). Doubling the GPU power (200 instead of 100 watts) resulted in 40 percent higher FPS in this scenario, which is not a particularly good scaling.
Assuming that the gap between GPU power and the total consumption of the graphics card (TGP) falls analogously to the GPU power (factory: 190 watts GPU power results in 230 watts TGP), a configuration of the Arc A770 with 140 watts of GPU power should be roughly equivalent to a GeForce RTX 3060 with 170 watts of TGP. In Doom, this configuration would mean a performance loss of 13 percent.
The measured values show that the Arc A770 does not consume a large part of the power consumption for the last x percent, as some products recently do, but scales fairly linearly with the power consumption. However, the increase in performance per watt is comparatively small.
Driver Anomalies and Problems
When testing the Intel Arc A380 in July, the driver used at the time (30.0.101.1743) was a disaster, which was not repeated when testing the Intel Arc A730M in September with driver 30.0.101.3276. The driver versions 30.0.101.3433 and 30.0.101.3435 now provided by Intel performed a bit better in terms of error susceptibility. Game crashes were only recorded in Spider-Man with driver 3433; this problem was also solved with driver 3435.
Nevertheless, this test did not run without problems either shortcomings or even mistakes. Specifically, the following points have been noticed over the past few days:
- Spider-Man would not start or crash with driver 3433 if RT reflections were activated before starting or in-game. Driver 3435 fixed the problem, but the RT reflections showed clearly visible display errors (A770, A750, A380).
 Display error of RT reflections in Spider- Man: Remastered
 - Even with driver 30.0.101.3435, HBAO+ cannot be used in Spider-Man (part of the “Very High” preset), display errors occur (A770, A750, A380).
 < /figure>


Even with driver 3435, there are display errors in Spider-Man: Remastered with HBAO+ instead of SSAO
- If FSR 2.0 is used in Death Stranding: Director's Cut on an Arc graphics card, there are severe graphics errors when stationary, which disappear immediately when moving.
- Blender Benchmark 3.0 (Render Engine 3.0.0) aborts with an error message (Arc A380 only).
- The Intel Arc Control Panel is still designed as an overlay. The Windows + Print command for screenshots is no longer ignored per se (OneDrive asks for storage in the cloud in the background), but screenshots are not created.
- The Affinity Photo application starts, but after the Confirming the test phase but closed without error message (Arc A770, A750 and A380). Planned benchmarks therefore failed.
- After changing the Arc graphics card, the driver must be reinstalled, and the installed driver (e.g. for A750) is automatically initialized on the new card (e.g. A770). not take place.
- A GPU clock offset of more than 50 leads to a crash immediately after confirmation in the Control Panel.
Overclocking
Intel Arc A770 and Arc A750 can be elicited a little more performance via the Intel Arc Control Center with two adjustment screws – at least in theory. The first is the maximum power loss available to the GPU, which is 190 watts ex works for both graphics cards, but can alternatively be increased to 228 watts (or reduced to 95 watts). The other is raising the maximum allowable GPU clock.
In practice, only the Intel Arc A770 benefited from a GPU power target increased from 190 to 228 watts, on average over the entire course it was 2 percent in WQHD , around 5 percent at the top. The total power consumption of the graphics card increases from 230 to 290 watts. With the Intel Arc A750, on the other hand, little or nothing happened.
The reason: The Intel Arc A750, which operates with fewer Xe cores, already clocks the GPU with 190 watts of GPU power at or just under the maximum clock rate of 2,400 MHz that is permissible without intervention, while the Intel Arc A770 – depending on the game – still offers up to 200 MHz reserve, which it can then use with 228 watts of GPU power.
For this reason, only the Arc A770 with maximized power limit is in included in the WQHD and FHD RT benchmarks above.
The 2,400 MHz limit can be circumvented in the driver by defining an offset between 0 and 100 percent (not MHz) via “GPU performance boost”. An offset of 10 corresponded to 2,435 instead of 2,400 MHz in the test with the Arc A770. Since an offset of more than 50 leads to a crash without delay after saving in the driver, the editors have not devoted any further time to this aspect for the time being.
Conclusion
The wait and the weekly marketing tidbits are over: With the Arc A770 and Arc A750, the large Alchemist graphics cards with a focus on PC gaming will be released in a week after a long delay. However, Intel is still a long way from reaching its goal, as the test made more than clear. The hoped-for alternative to the Nvidia GeForce RTX 3060 is not the Intel Arc A770 and Arc A750.
The Arc A770 Limited Edition and Arc A750 Limited Edition, as well as the provided drivers 30.0.101.3433 and 30.0.101.3435, were undoubtedly much better than the Gunnir Arc A380 Proton 6G imported by ComputerBase in July with the then public driver 30.0.101.1743. There were no more crashes in the game course with the latest driver and the two limited editions are very high quality instead of extremely cheap.
But viewed soberly, Intel still didn't manage to offer gamers an alternative to GeForce RTX or AMD Radeon RX that should be considered without hesitation at the beginning of October. This is also, but by no means only, due to the delivered performance.
 Intel Arc A770 and Arc A750 Limited Edition Review
It presented itself as follows: The Intel Arc A770 can only achieve a narrow victory over the GeForce RTX 3060 on average in the WQHD course and only there in the FPS. In terms of frame times and in lower resolutions, GeForce and Radeon are again ahead. The Arc A750 typically follows the Arc A770 by less than 10 percent. On average, Arc is far away from the performance in synthetic benchmarks, where even the RTX 3060 Ti is achieved.
It's no wonder that Intel recently put the price/performance ratio into the field. But this comparison only referred to the USA, while Intel did not even name a price for Germany in advance. To what extent an Arc A770 Limited Edition will really be cheaper in Germany than a GeForce RTX 3060, which is available from 380 euros, remains to be seen. 349 US dollars RRP excluding taxes, taking into account the current exchange rate and 19 percent VAT, makes you doubt that the price is significantly less than 380 euros.
 Intel Arc: A770 and A750 Limited Edition alongside Gunnir's Arc A380
 Intel Arc: A770 and A750 Limited Edition alongside Arc A380 by Gunnir
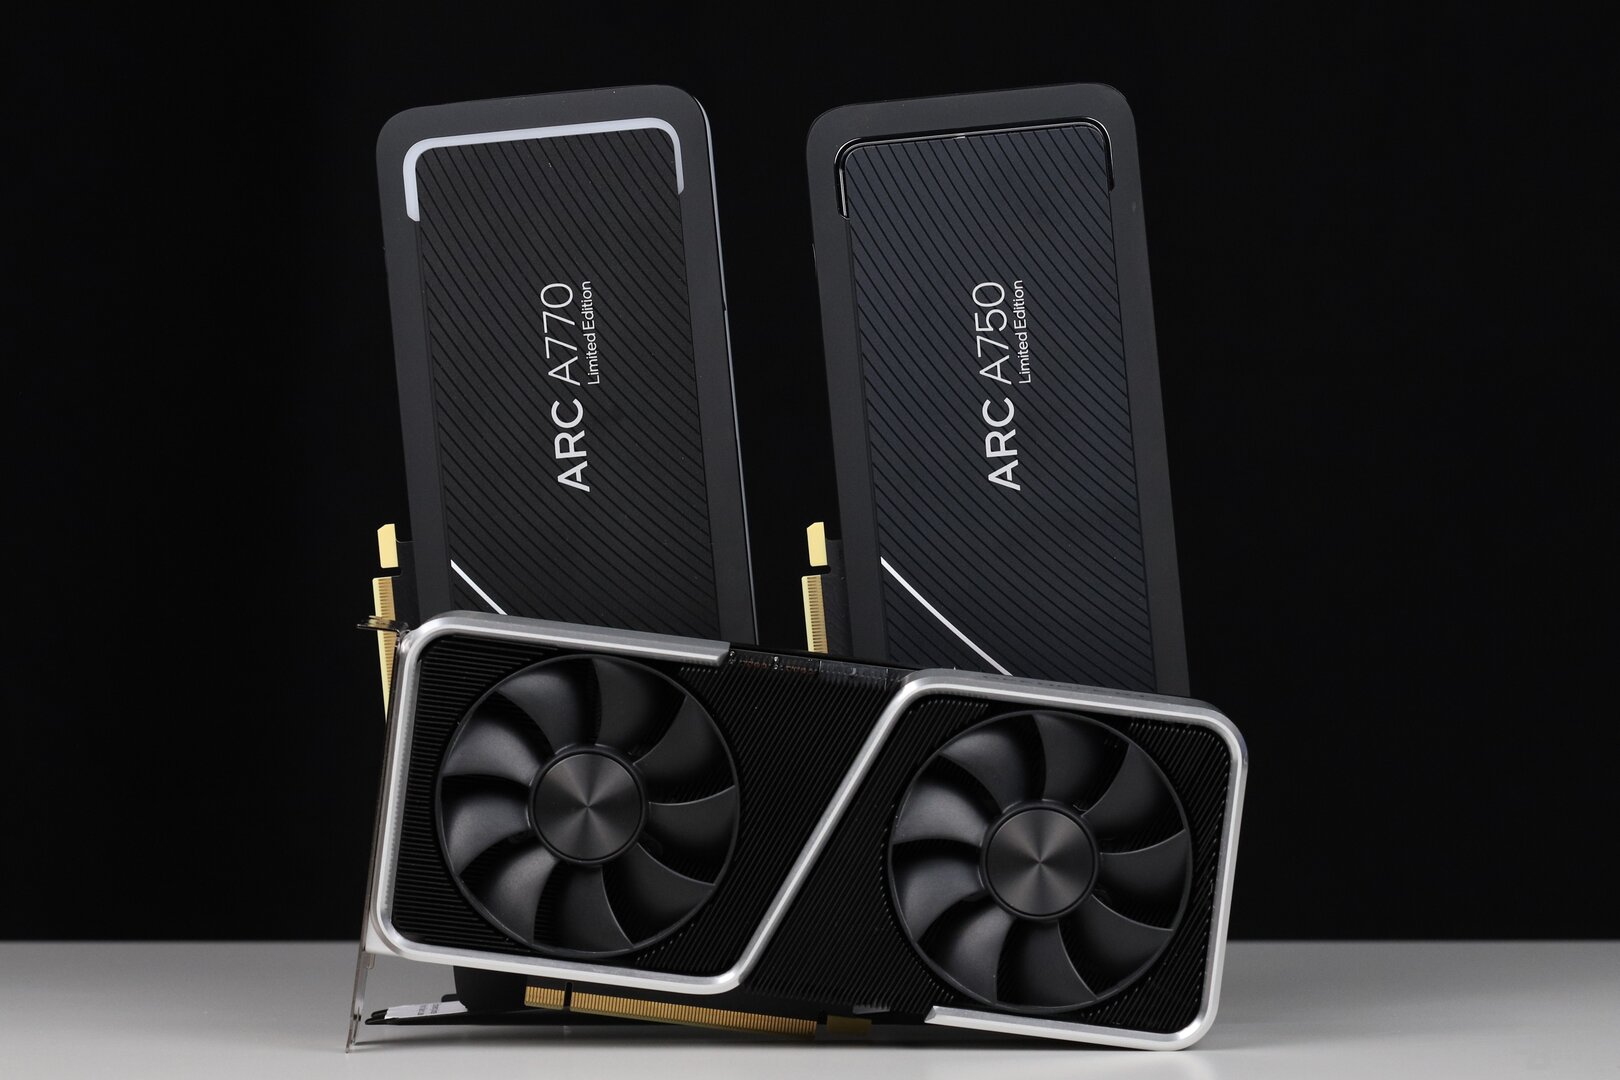 Arc A750 and A770 don't stand a chance against the GeForce RTX 3060 Ti
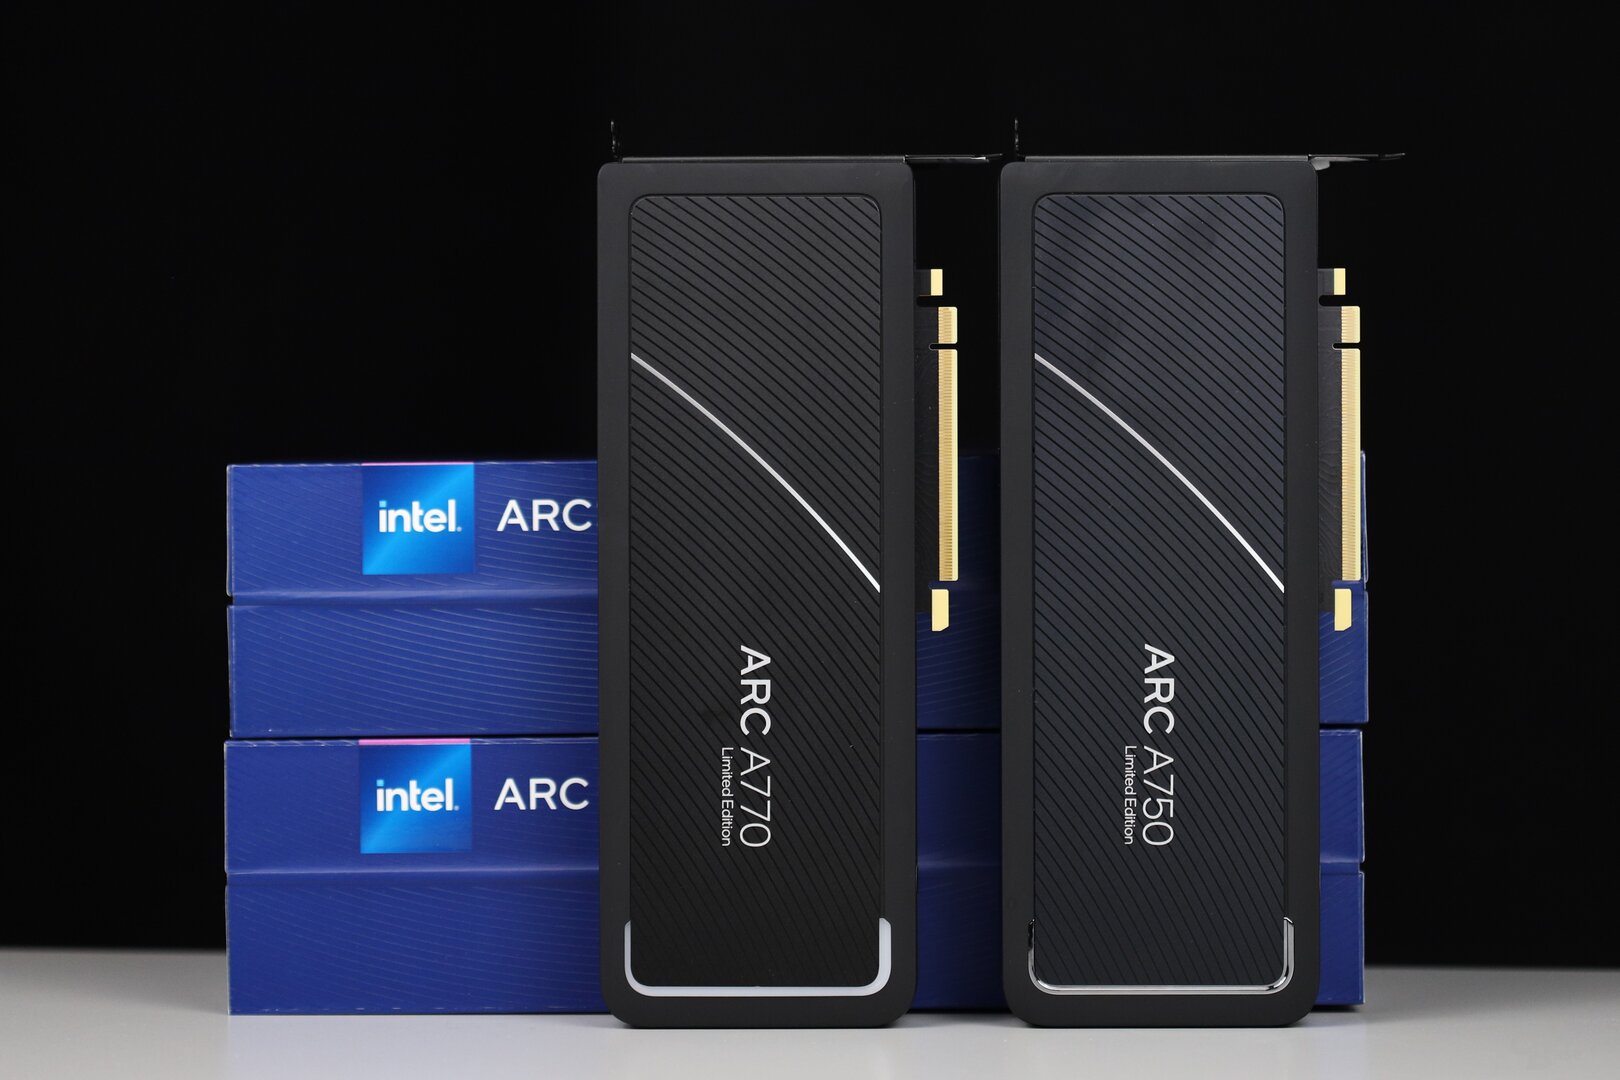 Intel Arc A770 and Arc A750 Limited Edition Review
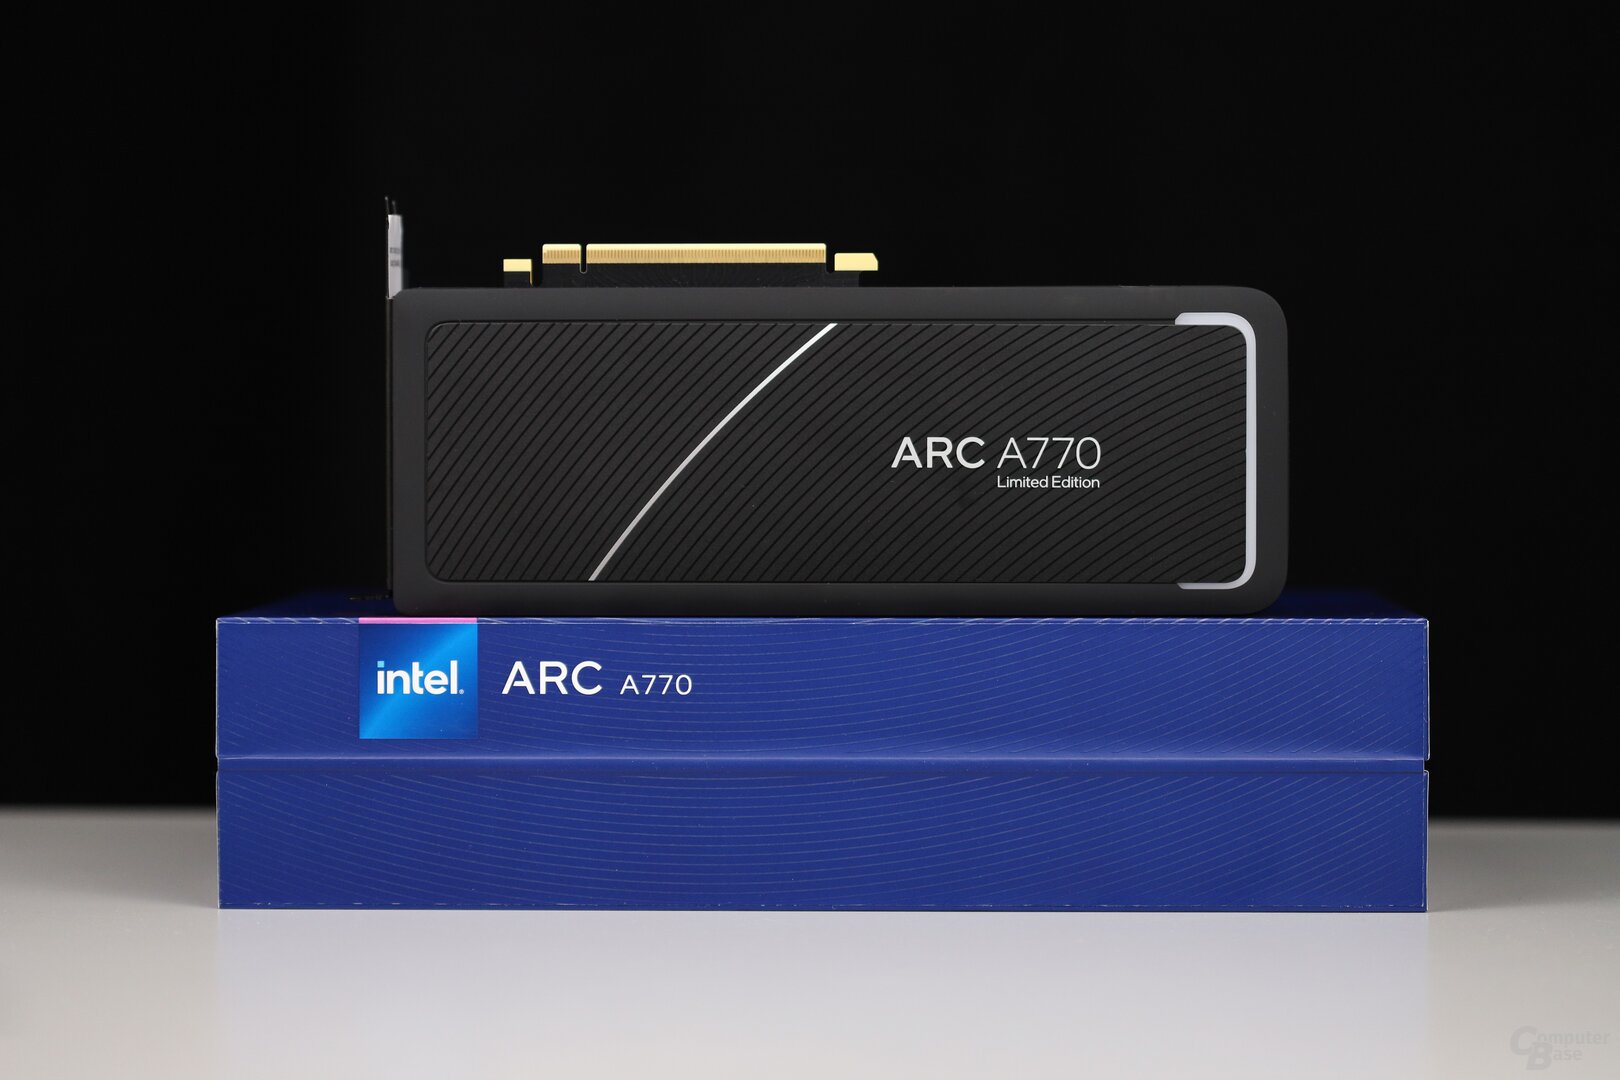 Intel Arc A770 Limited Edition 16GB
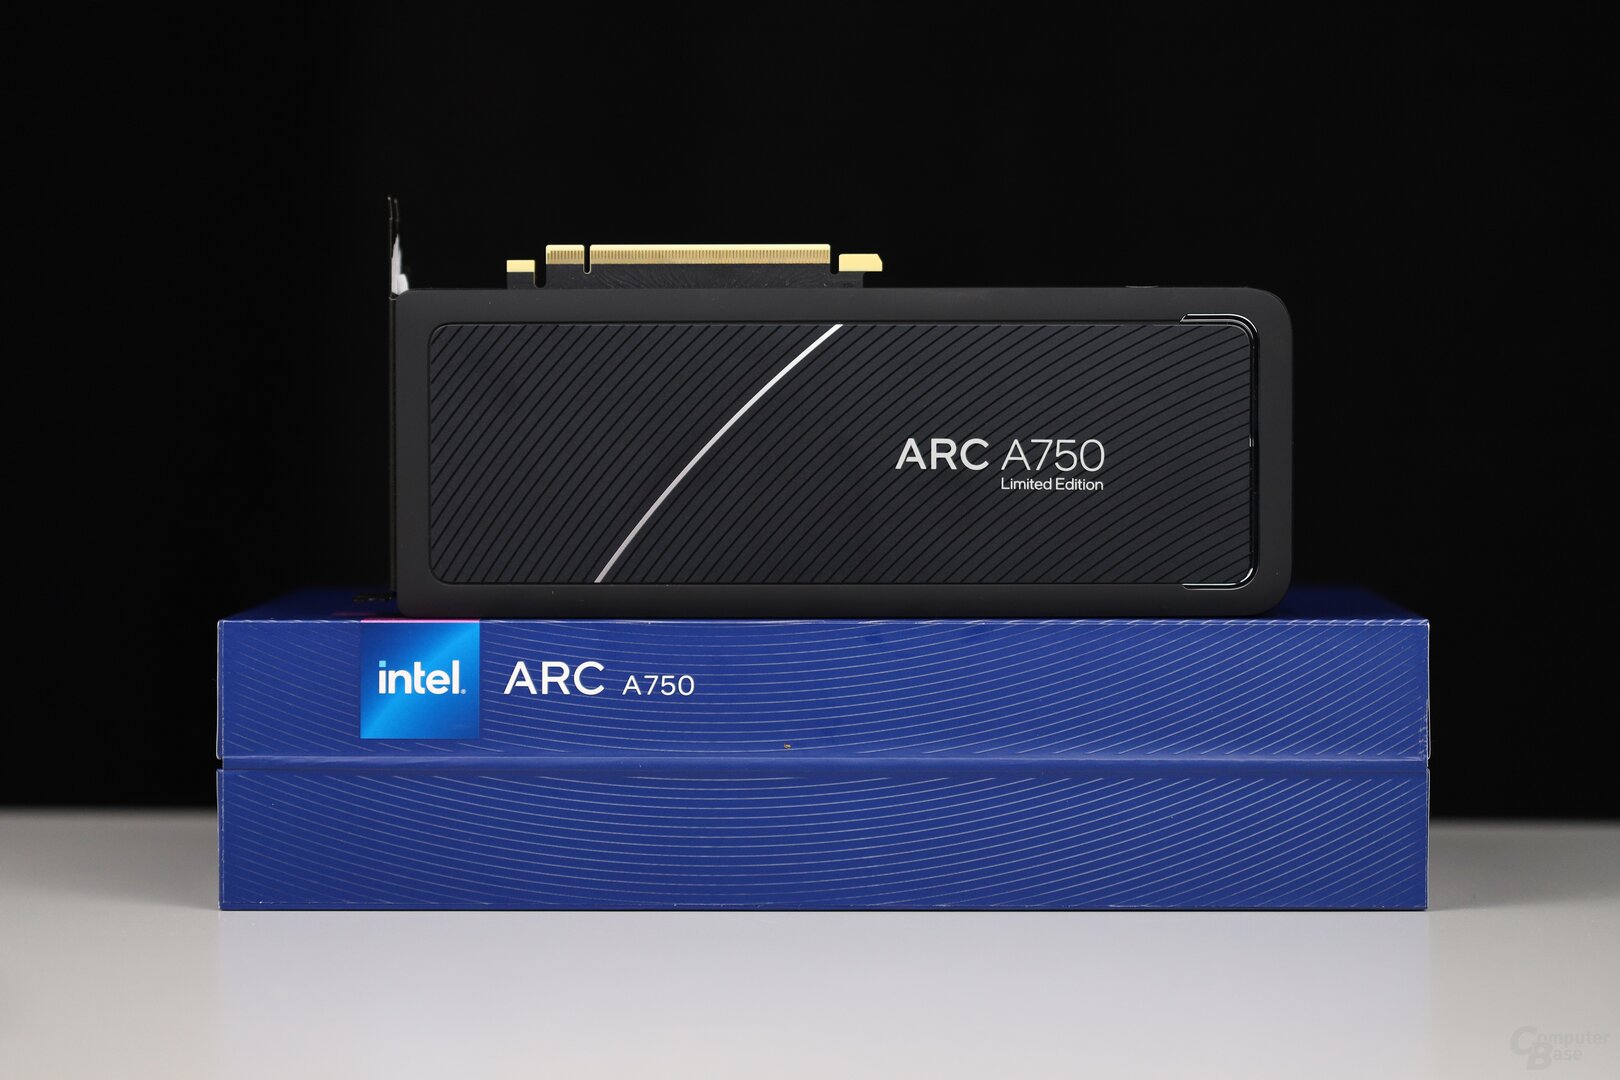 Intel Arc A750 Limited Edition with 8 GB
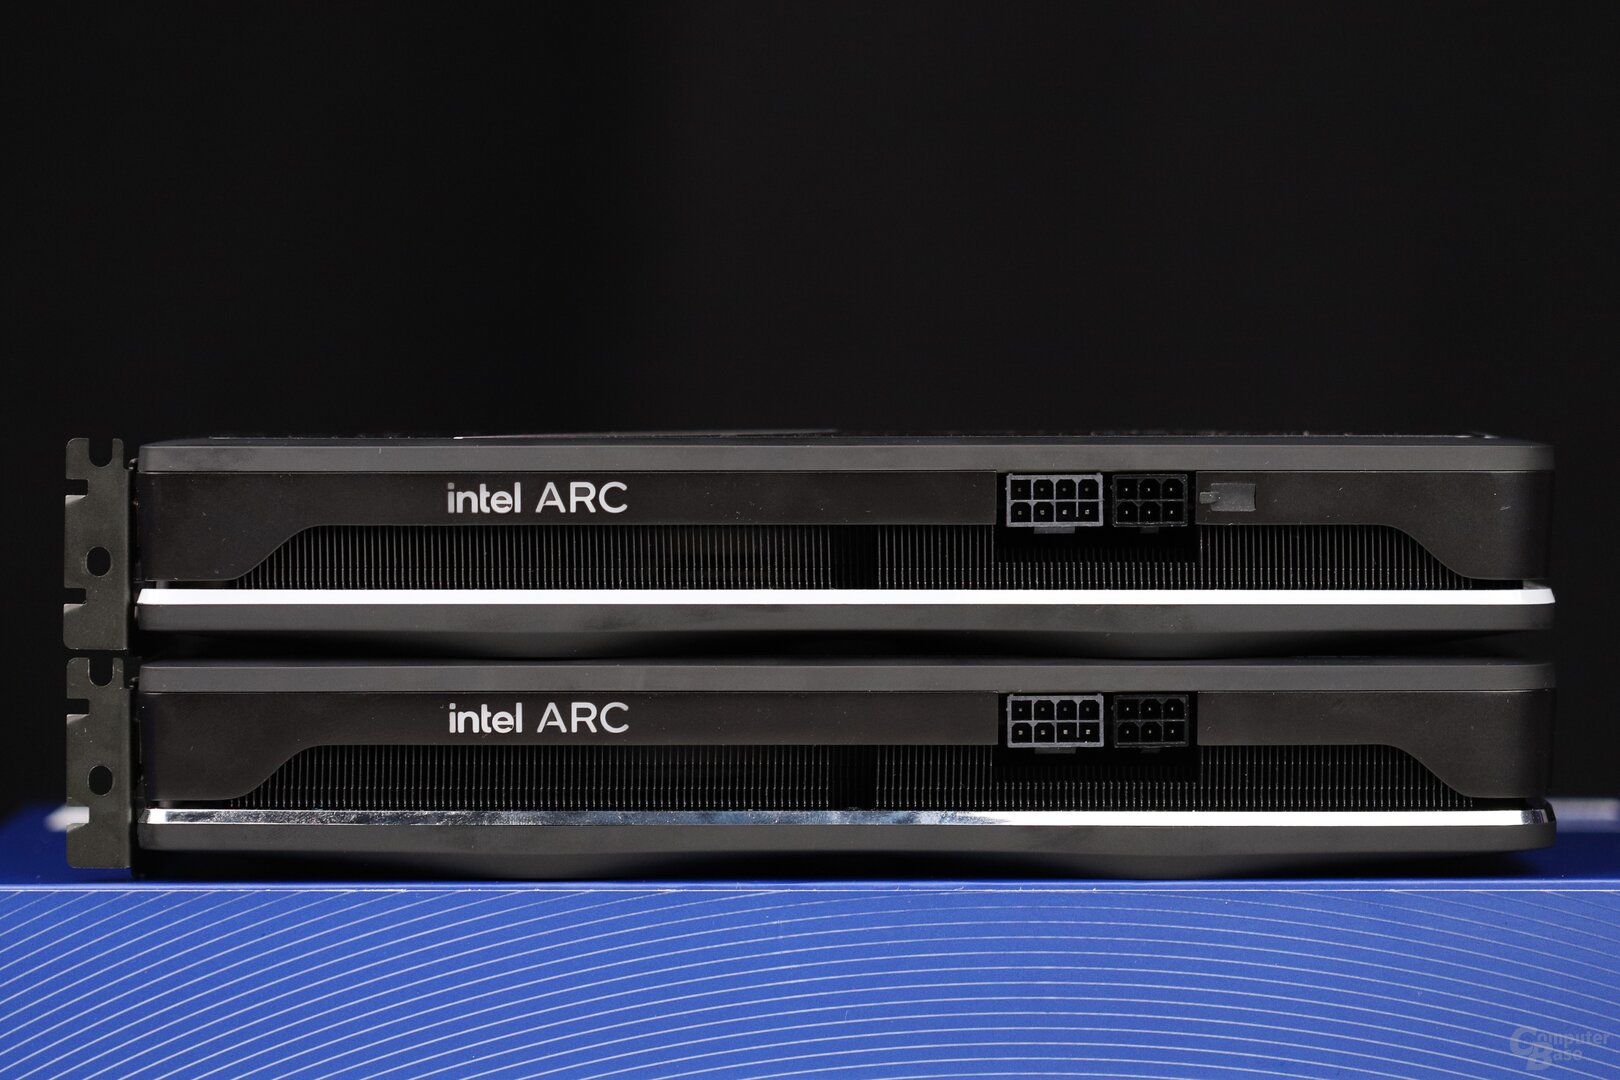 Intel Arc A770 vs. A750 Limited Edition: Externally except for Accents and RGB LEDs (A770 only) identical
 Intel's Limited Edition vs GeForce RTX 3060 Ti Founders Edition
 The RGB LEDs of the A770 Limited Edition are addressed via USB and not PCIe
< /figure>
Graphics cards and thus Intel Arc should not be considered purely from the perspective of FPS per euro. The video decoding and encoding as well as, to a limited extent, the compute performance and the processing of the Limited Edition are positive for Intel Arc. On the other hand, the power consumption (including at least 40 watts in idle mode under Windows), the fluctuating performance depending on the game and/or API and the desolate performance in DirectX 9 titles, which will not affect everyone, but still one, have to be rated negatively Restriction of the platform compared to the competing offers means.
In combination with the rarer but still existing driver problems even in flagship titles named by Intel (see Spider-Man), Intel Arc in the form of A770 and A750 clearly missed the goal set by Intel of millions of players this year To offer a more attractively priced alternative to the top dogs, of course. Intel Arc is too late, not fast enough and still has too many limitations.
This is not for the market, nor for gamers, nor for Intel good news and it is to be hoped that Intel will stay on the ball with GPUs in general and specifically with Arc for gaming offshoots and will solve the problems. But October 2022 is the State of the Arc.
It would be nice if Intel accompanied the upcoming work on Alchemist and its successors with a different communication strategy. Building up first and then messing up at the end didn't do the 1st generation any good. The 2nd should do better on this point as well.
What grade do you give Arc A770 and Arc A750 at the end of this test? (1 = Very good)
- 1
- 2
- 3
- 4
- 5
- 6
- Abstention (show result)
Please log in to vote!
ComputerBase was made available by Intel under NDA for Arc A770 Limited Edition and Arc A750 Limited Edition. The only requirement was the earliest possible publication date. The manufacturer did not influence the test report, there was no obligation to publish it.
This article was interesting, helpful or both? The Editors are happy about any support from ComputerBase Pro and disabled ad blockers. More about ads on ComputerBase.