AMD's Ryzen 7000 processors start with Zen 4 architecture. To start, ComputerBase traditionally took a close look at the Ryzen 9 7950X and Ryzen 7 7700X: The test with benchmarks in apps and games as well as IPC, clock, efficiency, UV and OC analyzes gives a comprehensive impression of the new generation.
Table of Contents
- 1 Performance, Efficiency, IPC, Clock, iGPU and more analyzed
- AMD Ryzen 7000 in the test
- A small teaser right at the start
- Start with Ryzen 9 7950X and Ryzen 7 7700X
- Model variants and prices (RRP) at the start< /li>
- Zen 4 vs. Zen 3: IPC, Clock & Comparison of latencies
- Zen 4 vs. Zen 3: Cache and RAM latencies compared
- 2 Power consumption and efficiency
- TDP and PPT increase significantly
< li>Power consumption in applications ex works
- Power consumption in games ex works
- Efficiency with reduced TDP (incl. Eco-Mode)
- Efficiency with reduced VCore (undervolting )
- Efficiency vs. bar-competition madness
- TJMax and temperatures under load
- Cooling Ryzen 7000 vs. Ryzen 5000
- Air vs. all-in-one water cooling
- Performance in single-core loads (classic)
- Performance in multi-core loads (classic)
- Performance in a new test course
- Performance in games with RTX 3090 Ti
< /li>
- iGPU performance in games, encoding and compute
- Game performance benchmarks
- Benchmarks for Encoding Performance
- Compute performance benchmarks (OpenCL)
- AV1 decoding on YouTube
- Ryzen 7000 can use AVX512
- PCIe speed comparison
- DDR5-5200 vs. DDR5-6000
- CPU-OC (PBO) vs. PPT and TJMax
- Info from Ryzen Tech Day
- Takeaways from everyday testing
- Performance vs. efficiency
- Ryzen 9 7950X: The fastest CPU
- Ryzen 7 7700X: great in games
- Ryzen 9 7900X & Ryzen 5 7600X: A conclusion is pending
- Ryzen 7000 on AM5: mature, but expensive
- Raptor Lake is fed up with cores
- Where are the gaming benchmarks ?
AMD Ryzen 7000 in test
24 hours before the start of sales on September 27, 2022, the embargo on tests of AMD's new processors fell. This test clarifies what the new generation can do in the usual detailed manner, including IPC, clock, efficiency, OC and UV analyses, extensive benchmarks, a look at the first iGPU in the Ryzen X series and much more.
A small teaser right at the start
Detailed benchmarks can be found on page 4 of this article, on pages 1 to 3 the architecture is first analyzed. However, the following teaser on the performance should make it clear right from the start: Ryzen 7000 is fast. Very fast.
Performance rating (Ø relative performance)
- Multi-Core< /li>
- Single-Core
Edit Multi-Core – Performance Rating (Average Relative Performance) Incoming Charts All No
- Multi-Core – 7-Zip
- Multi-Core – Agisoft PhotoScan Pro: Align Photos (84 JPEGs)
- Multi-Core – Blender Benchmark: Quick Benchmark
- Multi-Core – Cinebench R15 – Multi-Core
- Multi-Core – Cinebench R20 – Multi-Core
- Multi-Core – Corona 1.3 Benchmark
- Multi-Core – DigiCortex Simulation: BenchLarge
- Multi-Core – HandBrake
- Multi-Core – POV-Ray – Multi
-
- Ryzen 9 7950X
DDR5-5200CL32100 - Ryzen 9 5950X< br>DDR4-3200CL1473
- Core i9-12900K
DDR4-3200CL1466 - Ryzen 9 5900X
DDR4-3200CL1461 - Ryzen 7 7700X
DDR5-5200CL3257 - Core i7-12700K
DDR5-4800CL3256 - Core i5-12600K
DDR4-3200CL1444 - Ryzen 7 5800X
DDR4-3200CL1444 - Ryzen 7 5700X
DDR4-3200CL1440 - Ryzen 5 5600X
DDR4-3200CL1434 - Core i5-12500
DDR4-3200CL1433 - Core i5-12400
DDR4-3200CL1431
li>
- Ryzen 9 7950X
Unit: Percent Edit Single-Core – Performance Rating (Avg. Relative Performance) Incoming Graphs All None
- Single core – Cinebench R15
- Single Core – Cinebench R20
- Single Core – POV-Ray
-
- Ryzen 9 7950X
DDR5-5200CL32100 - Ryzen 7 7700X
DDR5-5200CL3298 - Core i9-12900K
DDR4-3200CL1495 - Core i7-12700K
DDR5-4800CL3290 - Core i5-12600K
DDR4-3200CL1490 - Core i5-12500
DDR4-3200CL1484 - Ryzen 9 5950X
DDR4-3200CL1482 - Ryzen 9 5900X
DDR4-3200CL1481 - Core i5-12400
DDR4-3200CL1480 - Ryzen 7 5800X
DDR4-3200CL1480 - Ryzen 7 5700X
DDR4-3200CL1477 - Ryzen 5 5600X
DDR4-3200CL1477
- Ryzen 9 7950X
Unit: percent
Startup with Ryzen 9 7950X and Ryzen 7 7700X
ComputerBase had both the Ryzen 9 7950X and the Ryzen 7 7700X available for testing in advance. AMD's test kit also included the Gigabyte X670E Aorus Master (BIOS: 813b) and G.Skill Trident Z5 DDR5-6000CL30 RAM with AMD Expo Profiles for Ryzen 7000. Asus is also providing a ROG Crosshair X670E Hero WiFi and Corsair DDR5-6000CL30 Dominator Platinum RGB.
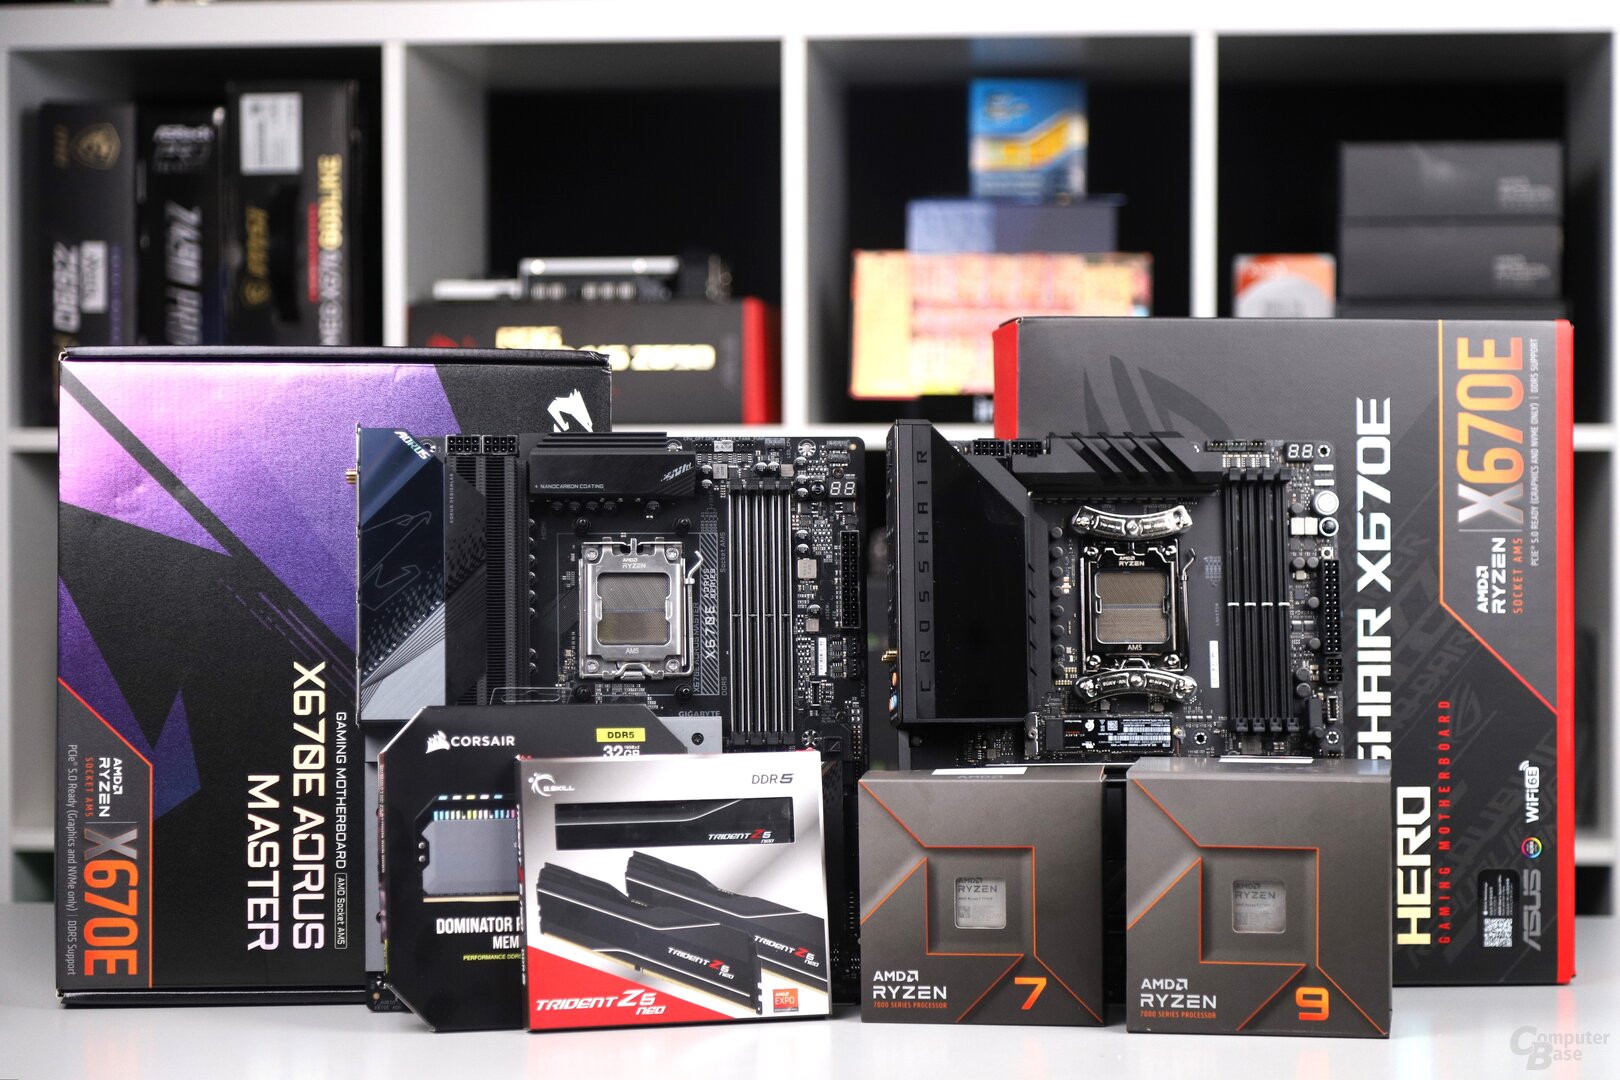 This hardware was available for testing AMD Ryzen 7000
How Ryzen 7000 was tested
This made it possible to test and gain experience on two systems in parallel. Unless otherwise stated, all test results in this article were determined on the Gigabyte X670E Aorus Master, which proved to be slightly more powerful and slightly less power-hungry under full load.
Tests were usually carried out with 2 × 16 GB DDR5-5200CL32 and standard specifications for TDP, PPT, ECD and TDC, but tests with DDR5-6000CL30 and higher CPU limits, manual OC and undervolting (less VCore) are also included in the article. Extensive use was made of the iGPU used for the first time in Ryzen desktop CPUs outside of the G series; a dedicated graphics card was only used for gaming and for power consumption measurements comparable to older tests.
Ryzen 9 7900X and Ryzen 5 7600X to follow
Unfortunately, attempts over the past few years to obtain the other two “stock keeping units” (SKUs) from other sources failed this year. After CPUs organized in this way were tested elsewhere at the beginning of 2022 without concealing their origin, and this was not without consequences, unfortunately nothing could be done about it. AMD's Ryzen 9 7900X and Ryzen 5 7600X models can be expected shortly.
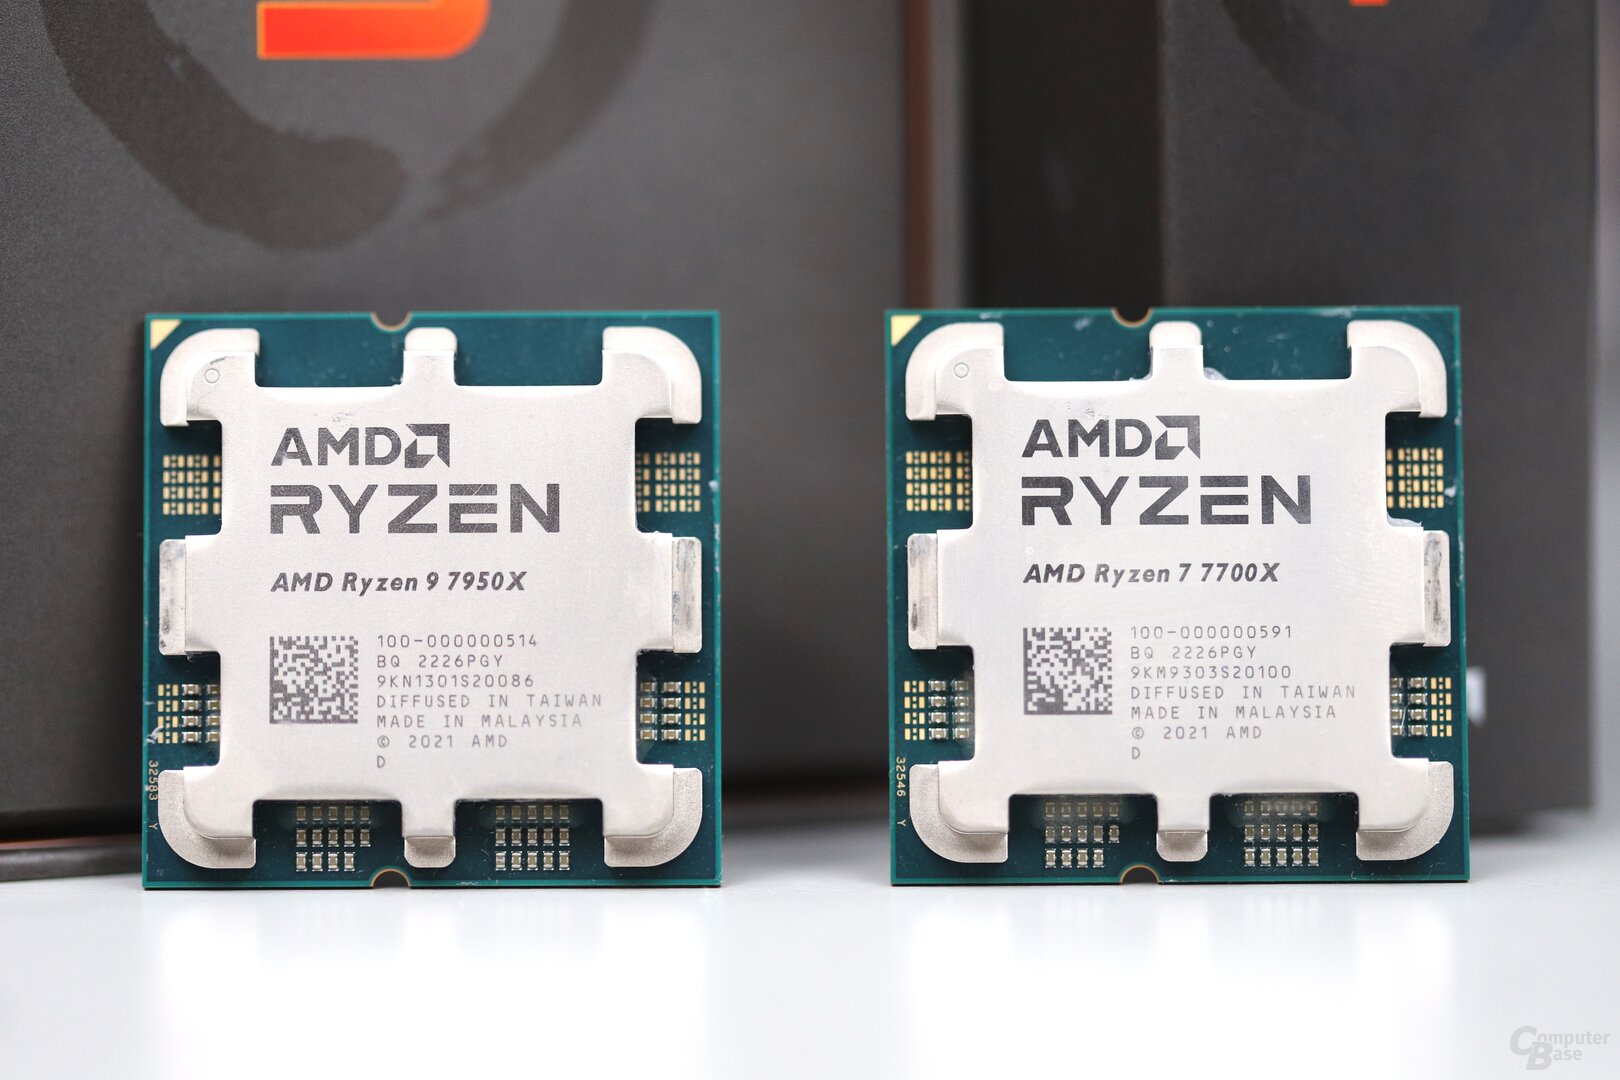 AMD Ryzen 9 7950X and Ryzen 7 7700X in the test
Model variants and prices (RRP) at the start
ComputerBase already reported extensively on Ryzen 7000 and the new AM5 platform for the final presentation at the end of August 2022. Essential information on the new architecture, the new Socket AM5, the new chipsets X670E, X670, B650E and B650 as well as DDR5 including AMD Expo as a competing technology for Intel XMP can therefore already be found elsewhere:
- AMD Ryzen 7000: Four new CPUs offer +13% IPC and up to 5.7 GHz clock
The core of what follows is an analysis of the new CPU and platform generation, although the Also good to know section contains some additional information from the AMD Ryzen Tech Day, which took place in Austin in August.
These are the RRPs for Germany
Shortly before the market launch, AMD first named the RRPs of the four models Ryzen 9 7950X, Ryzen 9 7900X, Ryzen 7 7700 and Ryzen 5 7600X for Germany. Given the USD-EUR parity and the fact that MSRPs in the US are quoted without VAT that varies locally, the “euro surcharge” is not surprising. For an assessment of the price development compared to Ryzen 5000, a look at the US prices is more useful.
First and foremost, the cheaper flagship is striking, but eight cores are also cheaper at the start of Zen 4 than at the start of Zen 3 – if you compare Ryzen 7 5800X with Ryzen 7 7700X. In comparison 5700X against 7700X, however, the price has increased significantly. Ryzen 9 7900X and Ryzen 5 7600X have not experienced any changes in the USA. The RRPs for Germany have all increased.
Base/Turbo L3 TDP iGPU Price RRP (Start) Price (current) AMD Ryzen 9 7950X Zen 4 16/32 4.5/5.7GHz 64MB < strong>170 W ✓ 849 euros (699 USD) – AMD Ryzen 9 5950X Zen 3 16/32 3.4/4.9 GHz 64 MB 105 W – 799 euros (799 USD ) from 529 euros AMD Ryzen 9 7900XZen 4 12/24 4.7/5.6 GHz 64 MB 170 W strong> ✓ 669 euros (549 USD) – AMD Ryzen 9 5900X Zen 3 12/24 3.7/4.8 GHz 64 MB 105 W – 549 euros (549 USD) from 399 euros AMD Ryzen AMD Ryzen 7 5800X Zen 3 8/16 3.8/4.7 GHz 32 MB 105W – 449 euros (449 USD) from 279 euros AMD Ryzen 7 7700X Zen 4 8/16 4.5/5.4 GHz 32 MB 105 W ✓ 479 euros ($399) – AMD Ryzen 7 5700X Zen 3 8/16 3.4/4.6GHz 32MB 65W – $299 from $249 AMD Ryzen 5 7600X Zen 4 strong> 6/12 4.7/5.3 GHz 32 MB 105 W ✓ 359 euros($299) – AMD Ryzen 5 5600X Zen 3 6/12 3.7/4.6GHz 32MB 65W – €299 ($299) from €185 AMD Ryzen 5 5600 Zen 3 6/12 3.5/4 .4GHz 32MB 65W – $199 from $149 AMD Ryzen 5 5500 Zen 3 6/12 3.6/4.2GHz 16MB 65W – $159 from $115 * As of September 26, 2022
Zen 4 vs. Zen 3: IPC, clock & Latency comparison
A new CPU generation can increase performance compared to its predecessor via three starting points: more clock, more power per clock and more cores. With the Ryzen 7000, AMD has changed two of the three adjustment screws with the change from Zen 3 to Zen 4: Both the clock and the performance per clock (IPC) have increased, the number of cores per CPU class has remained the same.
 All Ryzen 7000 of the X Class come without a cooler, the larger box of the Ryzen 9 is filled with foam rubber
Zen 4 vs. Zen 3: IPC comparison
According to AMD, Zen 4 should not work 8 or up to 10 percent faster than Zen 3, as initially promised, but around 13 percent faster with the same clock – in the desktop environment. AMD itself spoke of optimizations in the last few meters, but basically wanted to leave the competitor in the dark for as long as possible. But the evaluation basis presented in the end was also different – additional and benevolent applications were taken into account.
Because the Cinebench result shown in early summer is from Zen with a presented increase of 9 percent 3 on Zen 4 with the same clock still the same. But other apps presented by AMD – including games in particular – sometimes scale much better, so that the manufacturer was able to name an average of 13 percent in the end.
 A comparison of the old and the new package
 As an introduction to the test, ComputerBase determined how significantly the performance of the new CPUs has increased compared to Zen 1, Zen 2 and Zen 3 as well as Intel Alder Lake, each with 3.6 GHz (Zen 1 does not do more). There is a blur: All CPUs were operated with DDR4-3200CL14, only the Ryzen 7000 ran with DDR5-5200CL32 – the platform no longer supports DDR4.
IPC gain in the multi-core test course
On average, Ryzen 9 7950X and Ryzen 7 7700X react 12 percent faster under multi-core load compared to their ” direct” predecessors Ryzen 9 5950X and Ryzen 7 5800X when all running at 3.6 GHz.
Interesting: The Ryzen 7 7700X with 8 Zen 4 cores is tied at 3.6 GHz with the Core i9-12900K with 8 P cores (E cores were disabled for comparison).
Charts
- Performance rating applications (multi-core)
- IPC: 7-Zip
- IPC: Agisoft PhotoScan Pro
- IPC: Blender Benchmark
- IPC: Cinebench R15 – Multi
- IPC: Cinebench R20 – Multi
- IPC: Corona 1.3 Benchmark
- IPC: DigiCortex Simulation
- IPC: HandBrake
- IPC: POV-Ray – Multi
Edit Performance Rating Applications (Multi-Core) Inflow Charts All None
- IPC: Cinebench R15 – Multi
- IPC: Cinebench R20 – Multi
- IPC: POV-Ray – Multi
-
- AMD Ryzen 9 7950X @ 3.6 GHz100
- AMD Ryzen 9 5950X @ 3.6 GHz89
- AMD Ryzen 9 3950X @ 3.6 GHz81
- AMD Ryzen 9 5900X @ 3.6GHz71
- AMD Ryzen 9 3900X @ 3.6GHz62
- AMD Ryzen 7 7700X @ 3.6 GHz52
- Core i9-12900K @ 3.6 GHz51
- AMD Ryzen 7 5800X @ 3.6 GHz47
- AMD Ryzen 7 3800XT @ 3.6 GHz42
- AMD Ryzen 7 2700X @ 3.6 GHz36
- AMD Ryzen 7 1800X @ 3.6 GHz35
Unit: Percent IPC : 7-Zip
-
- AMD Ryzen 9 7950X @ 3.6 GHz161,181
- AMD Ryzen 9 5950X @ 3.6 GHz133,246
- AMD Ryzen 9 3950X @ 3.6 GHz119.632
- AMD Ryzen 9 5900X @ 3.6GHz107,098
- AMD Ryzen 9 3900X @ 3.6GHz101,961
- AMD Ryzen 7 7700X @ 3.6GHz91,350
- AMD Ryzen 7 5800X @ 3.6GHz81,400
- Core i9-12900K @ 3.6GHz75,683
- AMD Ryzen 7 3800XT @ 3.6GHz71,370
- AMD Ryzen 7 2700X @ 3.6GHz60,954
- AMD Ryzen 7 1800X @ 3.6GHz58,639
li>
Unit: MIPS IPC: Agisoft PhotoScan Pro
- Align Photos (84 JPEGs):
- AMD Ryzen 9 7950X @ 3.6 GHz137,562
- AMD Ryzen 9 3950X @ 3.6 GHz152,665
- AMD Ryzen 9 5950X @ 3.6 GHz153,902
- AMD Ryzen 9 5900X @ 3.6GHz176,238
- AMD Ryzen 9 3900X @ 3.6GHz179,231
- Core i9-12900K @ 3.6GHz202,227
- AMD Ryzen 7 7700X @ 3.6GHz206,721
- AMD Ryzen 7 5800X @ 3.6GHz217,726
- AMD Ryzen 7 3800XT @ 3.6GHz229,227
- AMD Ryzen 7 2700X @ 3.6GHz243,129
- AMD Ryzen 7 1800X @ 3.6GHz263,346
Unit: seconds IPC: Blender Benchmark
- Quick Benchmark:
- AMD Ryzen 9 7950X @ 3.6GHz7:49
- AMD Ryzen 9 5950X @ 3.6 GHz8:37
- AMD Ryzen 9 3950X @ 3.6 GHz9:04
- AMD Ryzen 9 5900X @ 3, 6GHz11:31
- AMD Ryzen 9 3900X @ 3.6GHz12:01
- AMD Ryzen 7 7700X @ 3.6GHz15:27
- Core i9-12900K @ 3.6GHz15:30
- AMD Ryzen 7 5800X @ 3.6GHz17:09
- AMD Ryzen 7 3800XT @ 3.6GHz18:01
- AMD Ryzen 7 2700X @ 3.6GHz20:22
- AMD Ryzen 7 1800X @ 3.6GHz21:46
Unit: Minutes, Seconds IPC: Cinebench R15 – Multi
-
- AMD Ryzen 9 7950X @ 3.6GHz4,530
- AMD Ryzen 9 5950X @ 3.6GHz 4,070
- AMD Ryzen 9 3950X @ 3.6 GHz3,704
- AMD Ryzen 9 5900X @ 3.6 GHz3. 099
- AMD Ryzen 9 3900X @ 3.6 GHz2.847
- AMD Ryzen 7 7700X @ 3.6 GHz2,320
- Core i9-12900K @ 3.6 GHz2,123
- < strong>AMD Ryzen 7 5800X @ 3.6 GHz2,079
- AMD Ryzen 7 3800XT @ 3.6 GHz1,898
- AMD Ryzen 7 2700X @ 3.6 GHz1,649
- AMD Ryzen 7 1800X @ 3.6 GHz1,580
-
- AMD Ryzen 9 7950X @ 3.6 GHz10,604
- AMD Ryzen 9 5950X @ 3.6GHz9,405
- AMD Ryzen 9 3950X @ 3.6GHz8,505
< li class="chart__row">AMD Ryzen 9 5900X @ 3.6 GHz7,183
- AMD Ryzen 9 3900X @ 3.6 GHz6,415
- Core i9-12900K @ 3.6GHz5,726
- AMD Ryzen 7 7700X @ 3.6 GHz5,488
- AMD Ryzen 7 5800X @ 3.6 GHz4,849
- AMD Ryzen 7 3800XT @ 3.6 GHz4.350
- AMD Ryzen 7 2700X @ 3.6 GHz3.716
- AMD Ryzen 7 1800X @ 3.6 GHz3.523
Unit: Points IPC: Corona 1.3 Benchmark
-
- AMD Ryzen 9 7950X @ 3.6 GHz48
- AMD Ryzen 9 5950X @ 3.6 GHz52
- AMD Ryzen 9 3950X @ 3.6 GHz64
- AMD Ryzen 9 5900X @ 3.6 GHz69
- AMD Ryzen 9 3900X @ 3.6GHz80
- AMD Ryzen 7 7700X @ 3.6GHz97
- Core i9- 12900K @ 3.6GHz97
- AMD Ryzen 7 5800X @ 3.6GHz103
- AMD Ryzen 7 3800XT @ 3.6 GHz119
- AMD Ryzen 7 2700X @ 3.6 GHz131
- AMD Ryzen 7 1800X @ 3.6 GHz135
Unit: Seconds IPC: DigiCortex Simulation
- BenchLarge:
- AMD Ryzen 9 7950X @ 3.6 GHz9,547< /li>
- AMD Ryzen 9 5950X @ 3.6GHz10,730
- AMD Ryzen 9 3950X @ 3.6GHz12,422
- AMD Ryzen 9 5900X @ 3.6GHz13.328
- AMD Ryzen 9 3900X @ 3.6GHz15.203
- AMD Ryzen 7 7700X @ 3.6GHz17,500
- AMD Ryzen 7 5800X @ 3.6GHz19,015
- Core i9-12900K @ 3.6GHz19,875
- AMD Ryzen 7 3800XT @ 3.6GHz22,313
- AMD Ryzen 7 2700X @ 3.6GHz27,734
- AMD Ryzen 7 1800X @ 3.6 GHz28.890
Unit: milliseconds IPC: HandBrake
-
- AMD Ryzen 9 7950X @ 3.6 GHz0:46
- AMD Ryzen 9 5950X @ 3.6GHz0:50
- AMD Ryzen 9 3950X @ 3.6GHz0:57
- AMD Ryzen 9 5900X @ 3.6GHz1:01
- AMD Ryzen 9 3900X @ 3.6GHz1:08
- AMD Ryzen 7 7700X @ 3.6GHz1:11
- Core i9-12900K @ 3.6GHz1:18
- AMD Ryzen 7 5800X @ 3.6GHz1:22
- AMD Ryzen 7 3800XT @ 3.6GHz1:30
- AMD Ryzen 7 2700X @ 3.6GHz1:56
- AMD Ryzen 7 1800X @ 3.6 GHz2:03
Unit: Minutes, Seconds IPC: POV-Ray – Multi
-
- AMD Ryzen 9 7950X @ 3.6GHz9,016
- AMD Ryzen 9 5950X @ 3.6GHz8,108
- AMD Ryzen 9 3950X @ 3.6 GHz7.234
- AMD Ryzen 9 5900X @ 3.6GHz7,005
- AMD Ryzen 9 3900X @ 3.6GHz5,606
- AMD Ryzen 7 7700X @ 3.6GHz4,852
- Core i9-12900K @ 3.6GHz4,757
- AMD Ryzen 7 5800X @ 3.6 GHz4,321
- AMD Ryzen 7 3800XT @ 3.6 GHz3,879
- AMD Ryzen 7 2700X @ 3.6GHz3,372
- AMD Ryzen 7 1800X @ 3.6GHz3,229
Unit: Points
IPC gain in the single-core test course
The increase in the single-core loads used by the editors for the Ryzen 5000 for the IPC comparison is less clear. Zen 4 is up 6 percent (Ryzen 7) or 7 percent (Ryzen 9) compared to Zen 3 – the large performance cores in Intel Alder Lake remain in the lead by 4 percent. AMD has their interaction better under control, otherwise the “multi-core IPC” would not be as high.
Charts
- Performance rating applications (single core)
- IPC: Cinebench R15 – Single
- IPC: Cinebench R20 – Single
- IPC: POV-Ray – Single
Edit Performance Rating Applications (Single-Core) Inflowing Charts All None
- IPC: Cinebench R15 – Single
- IPC: Cinebench R20 – Single
- IPC: POV-Ray – Single
-
- Core i9-12900K @ 3.6GHz99
- AMD Ryzen 9 7950X @ 3.6GHz95
- AMD Ryzen 7 7700X @ 3.6 GHz95
- AMD Ryzen 7 5800X @ 3.6 GHz89
- AMD Ryzen 9 5950X @ 3.6 GHz89
- AMD Ryzen 9 5900X @ 3.6 GHz89
- AMD Ryzen 9 3950X @ 3.6 GHz78
- AMD Ryzen 7 3800XT @ 3.6 GHz78
- AMD Ryzen 9 3900X @ 3.6GHz78
- AMD Ryzen 7 2700X @ 3.6GHz70
- AMD Ryzen 7 1800X @ 3.6 GHz68
Unit: Percent IPC: Cinebench R15 – Single
-
- AMD Ryzen 9 7950X @ 3.6 GHz211< /li>
- AMD Ryzen 7 7700X @ 3.6GHz210
- Core i9-12900K @ 3.6GHz206< /li>
- AMD Ryzen 7 5800X @ 3.6GHz200
- AMD Ryzen 9 5950X @ 3.6 GHz199
- AMD Ryzen 9 5900X @ 3.6 GHz198
- AMD Ryzen 7 3800XT @ 3.6 GHz171
- AMD Ryzen 9 3950X @ 3.6 GHz170
- AMD Ryzen 9 3900X @ 3.6 GHz169
- AMD Ryzen 7 2700X @ 3.6 GHz152
- AMD Ryzen 7 1800X @ 3.6GHz147
Unit: Points IPC: Cinebench R20 – Single
-
- < li class="chart__row">Core i9-12900K @ 3.6 GHz542
- AMD Ryzen 9 7950X @ 3.6 GHz505
- AMD Ryzen 7 5800X @ 3.6 GHz strong>467
- AMD Ryzen 9 5950X @ 3.6 GHz466
- AMD Ryzen 9 5900X @ 3.6 GHz465
- AMD Ryzen 9 3950X @ 3.6 GHz421
- AMD Ryzen 9 3900X @ 3.6GHz419
- AMD Ryzen 7 3800XT @ 3.6GHz419
- AMD Ryzen 7 2700X @ 3.6 GHz374
- AMD Ryzen 7 1800X @ 3.6 GHz364
< li class="chart__row">AMD Ryzen 7 7700X @ 3.6 GHz504
Unit: Points IPC: POV-Ray – Single
-
- Core i9-12900K @ 3.6GHz521
- AMD Ryzen 9 7950X @ 3.6 GHz487
- AMD Ryzen 7 7700X @ 3.6 GHz480
- AMD Ryzen 9 5950X @ 3.6 GHz458
- AMD Ryzen 7 5800X @ 3.6 GHz457
- AMD Ryzen 9 5900X @ 3.6GHz457
- AMD Ryzen 9 3950X @ 3.6 GHz397
- AMD Ryzen 7 3800XT @ 3.6 GHz395
- AMD Ryzen 9 3900X @ 3.6 GHz394
- AMD Ryzen 7 2700X @ 3.6 GHz353
- AMD Ryzen 7 1800X @ 3.6 GHz351
Unit: points
With Ryzen 5000, it was the other way around recently: the CPUs increased more significantly in single-core loads than in multi-core scenarios .
IPC profit in the game test course
In games, the editors have an IPC profit of 11 percent (FPS) and 13 percent (percentile FPS) respectively. Intel Alder Lake remains in the lead with 5 and 6 percent, respectively, the Ryzen 7 5800X3D with the L3 cache attached even with 19 and 21 percent. Tested at 720p on a GeForce RTX 3090 Ti to keep the GPU out of the equation as much as possible.
Rating IPC comparison
- Rasterizer, AVG-FPS
- Rasterizer, Percentile FPS
Edit Rating IPC Comparison – Rasterizer, AVG FPS Inflow Charts All None
- < li>Age of Empires 4 – 1,280 × 720, IPC comparison: FPS, average
- Anno 1800 – 1,280 × 720, IPC comparison: FPS, average
- COD Warzone – 1,280 × 720, IPC comparison: FPS, Average
- Cyberpunk 2077 + RT – 1280×720, IPC comparison: FPS, Average
- DOTA 2 – 1280×720, IPC comparison: FPS, Average
- Death Stranding – 1280×720, IPC Comparison: FPS, Average
- F1 22 – 1280×720, IPC Comparison: FPS, Average
- Far Cry 6 + RT – 1280×720, IPC -Comparison: FPS, average
- Fortnite – 1280×720, IPC comparison: FPS, average
- Ghostwire Tokyo – 1280×720, IPC comparison: FPS, average
- Guardians of the Galaxy – 1280×720, IPC Comparison: FPS, Average
- Resident Evil Village – 1280×720, IPC Comparison: FPS, Average
- Spider-Man Remastered + RT – 1280×720, IPC Comparison: FPS, Average
- Spider-Man Remastered – 1280×720, IPC Comparison: FPS, Average
- Valorant – 1280×720, IPC -Comparison: FPS, Average
-
- Ryzen 7 5800X3D @ 4.4GHz98.5
- Core i7-12700K @ 4.4GHz86.7
- Ryzen 7 7700X @ 4.4GHz82.6
- Ryzen 7 5800X @ 4.4GHz74.6
Unit: Percent Edit Rating IPC Comparison – Rasterizer, Percentile FPS Inflow Charts All None
- Age of Empires 4 – 1280×720, IPC -Comparison: FPS, 1% percentile
- Anno 1800 – 1,280×720, IPC comparison: FPS, 1% percentile
- COD Warzone – 1,280×720, IPC comparison: FPS, 1% percentile
- Cyberpunk 2077 + RT – 1280×720, IPC comparison: FPS, 1% percentile
- DOTA 2 – 1280×720, IPC comparison: FPS, 1% percentile
- Death Stranding – 1280×720 , IPC comparison: FPS, 1% percentile
- F1 22 – 1,280 × 720, IPC comparison: FPS, 1% percentile
- Far Cry 6 + RT – 1,280 × 720, IPC comparison: FPS, 1% percentile
- Fortnite – 1280×720, IPC comparison: FPS, 1% percentile
- Ghostwire Tokyo – 1280×720, IPC comparison: FPS, 1% percentile
- Guardians of the Galaxy – 1280×720, IPC comparison: FPS, 1% percentile
- Resident Evil Village – 1280×720, IPC comparison: FPS, 1% percentile
- Spider-Man Remastered + RT – 1,280×720, IPC comparison: FPS, 1% percentile
- Spider-Man Remastered – 1,280×720, IPC comparison: FPS, 1% percentile
- Valorant – 1,280× 720, IPC comparison: FPS, 1% percentile
-
- Ryzen 7 5800X3D @ 4.4GHz98.2
- Core i7-12700K @ 4.4GHz85.8
- Ryzen 7 7700X @ 4.4GHz81.2
- Ryzen 7 5800X @ 4.4GHz72.0
unit : percent
The following article provides further gaming benchmarks with and without RAM OC in comparison to Intel Alder Lake and Ryzen 5000(X3D):
- Gaming benchmarks : Ryzen 9 7950X and Ryzen 7 7700X vs. 5950X and 12900KS
Zen 4 vs. Zen 3: clock comparison< /h3>
With Zen 4, more IPC per clock is only one side of the coin, the other is the clock itself. Just looking at the key technical data listed above makes it clear that the clock has increased significantly. But that doesn't have to be all.
Ryzen 7000 can also clock higher
After the clock disaster with Ryzen 3000, when many SKUs did not reach the promised maximum turbo clock rates, Ryzen 7000, like Ryzen 5000, takes a different path: In practice, the CPUs can, if temperature, load and other factors affecting the turbo allow it, clock even higher.
Specifically, the Ryzen 9 7950X achieved up to 5,730 MHz in the editorial test, the Ryzen 7 7700X even up to 5,556 MHz – 156 MHz more than advertised . On average over a Cinebench R23 single-core run, the 7950X again hit the advertised clock exactly, while the Ryzen 7 7700X ran the entire benchmark with 156MHz more clock on the fastest core.
The clock rates of the first two Ryzen 7000s in the editorial department are compared below in a single, multi-core and three game loads. In the Cinebench R20 single-core and in the games, it is the average maximum clock on the respectively fastest core in the benchmark, in the Blender benchmark (multi-core) it is the average clock across all cores in the benchmark. The results speak for themselves.
The Ryzen 7 7700X clocked extremely high in the test
Once again, the clock rates of the Ryzen 7 7700X are remarkable: With an average of 5,296 MHz in the Blender benchmark, the CPU is only 104 MHz away from the official maximum turbo in multi-core full loads and in all tested games are (as in the Cinebench single core) consistently 5,550 MHz – 150 MHz more than officially stated.
clock rates in other games and many other gaming benchmarks with and without RAM OC compared to Intel Alder Lake and Ryzen 5000(X3D) provides the following article:
- Gaming benchmarks: Ryzen 9 7950X and Ryzen 7 7700X vs. 5950X and 12900KS
Zen 4 vs. Zen 3: Cache and RAM latencies compared
Cache and RAM latencies were a big issue with Ryzen 1000 and Ryzen 2000 with Zen or Zen+, which has receded into the background with the improvements in Zen 2 and Zen 3 (despite I/O die). Typical were Ryzen 5000 latencies of 0.8 ns, 2.5 ns and 10.x ns for L1, L2 and L3 cache.
 Zen 3 to Zen 4 and the changes (Image: AMD)
 The cache at a glance (Image: AMD)
On Ryzen 9 7950X and Ryzen 7 7700X, both L1 and L3 cache latency have continued to drop, with L3 cache progress is clear. The response time of the L3 cache, measured in clock cycles, has even increased from Zen 3 to Zen 4, but this is more than compensated for by the higher L3 cache clock.
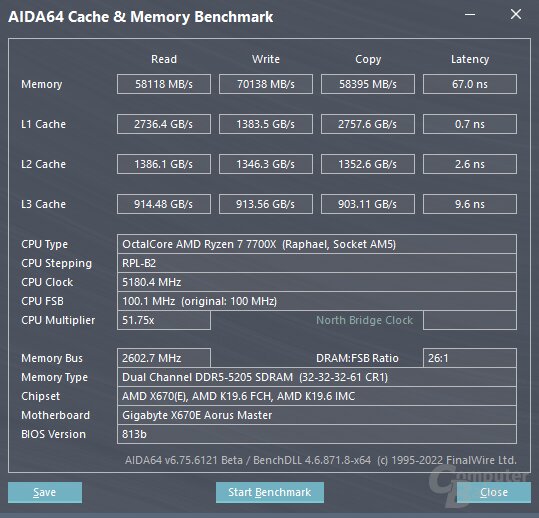 AMD Ryzen 7 7700X: Cache latencies
 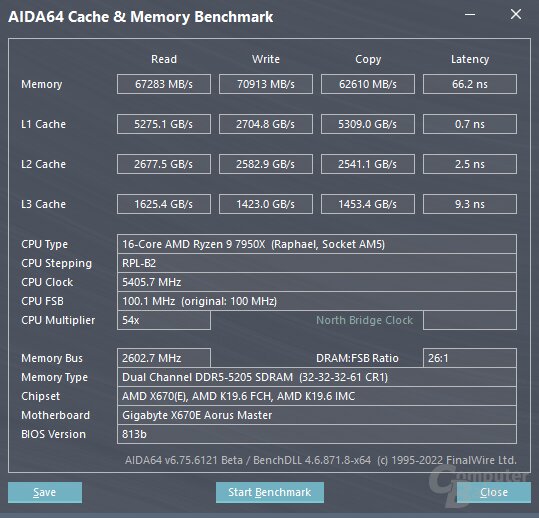 AMD Ryzen 9 7950X: Cache Latencies
The memory latency has increased slightly, comparing DDR4-3200CL14 on Ryzen 5000 with DDR5-5200CL32 on Ryzen 7000. With DDR5-6000CL30, the sweet spot defined by AMD, Ryzen 7000 is also ahead in this respect.
Page 1/8 Next page
Power consumption and efficiency