
Despite PCIe 3.0 on the P3 and PCIe 4.0 on the P3 Plus, the new Crucial SSDs use the same components with Phison E21T and 176-layer QLC on an almost identical PCB. In the test, the controller-NAND combination shows blatant weaknesses in reading and writing, which the Crucial P3 and P3 Plus also share.
Table of contents
- 1 Crucial P3 and P3 Plus SSD in detail
- Controller and NAND are identical
- Differences in detail
- The new Phison E21T controller< /li>
- Warranty and TBW in comparison
- Prices and key data at a glance
- Test results and benchmarks
- Cache analysis (SLC mode)
- Copy operations in Explorer
- PCMark 10 performance consistency
- CrystalDiskMark
- Conclusion
Crucial P3 and P3 Plus SSD in detail
At the end of May, Micron's brand subsidiary Crucial will have two new ones, the P3 and P3 Plus SSD series presented, which are located below the P5 (test) and P5 Plus (test) with less performance. Now the test follows on ComputerBase.
Controller and NAND are identical
Right at the start, the editors' view caused a big surprise under the black stickers of the two M.2 SSDs. Although the P3 with PCIe 3.0 and a maximum of 3,500 MB/s and the P3 Plus with PCIe 4.0 and a maximum of 5,000 MB/s differ significantly on paper, they are essentially technology twins.


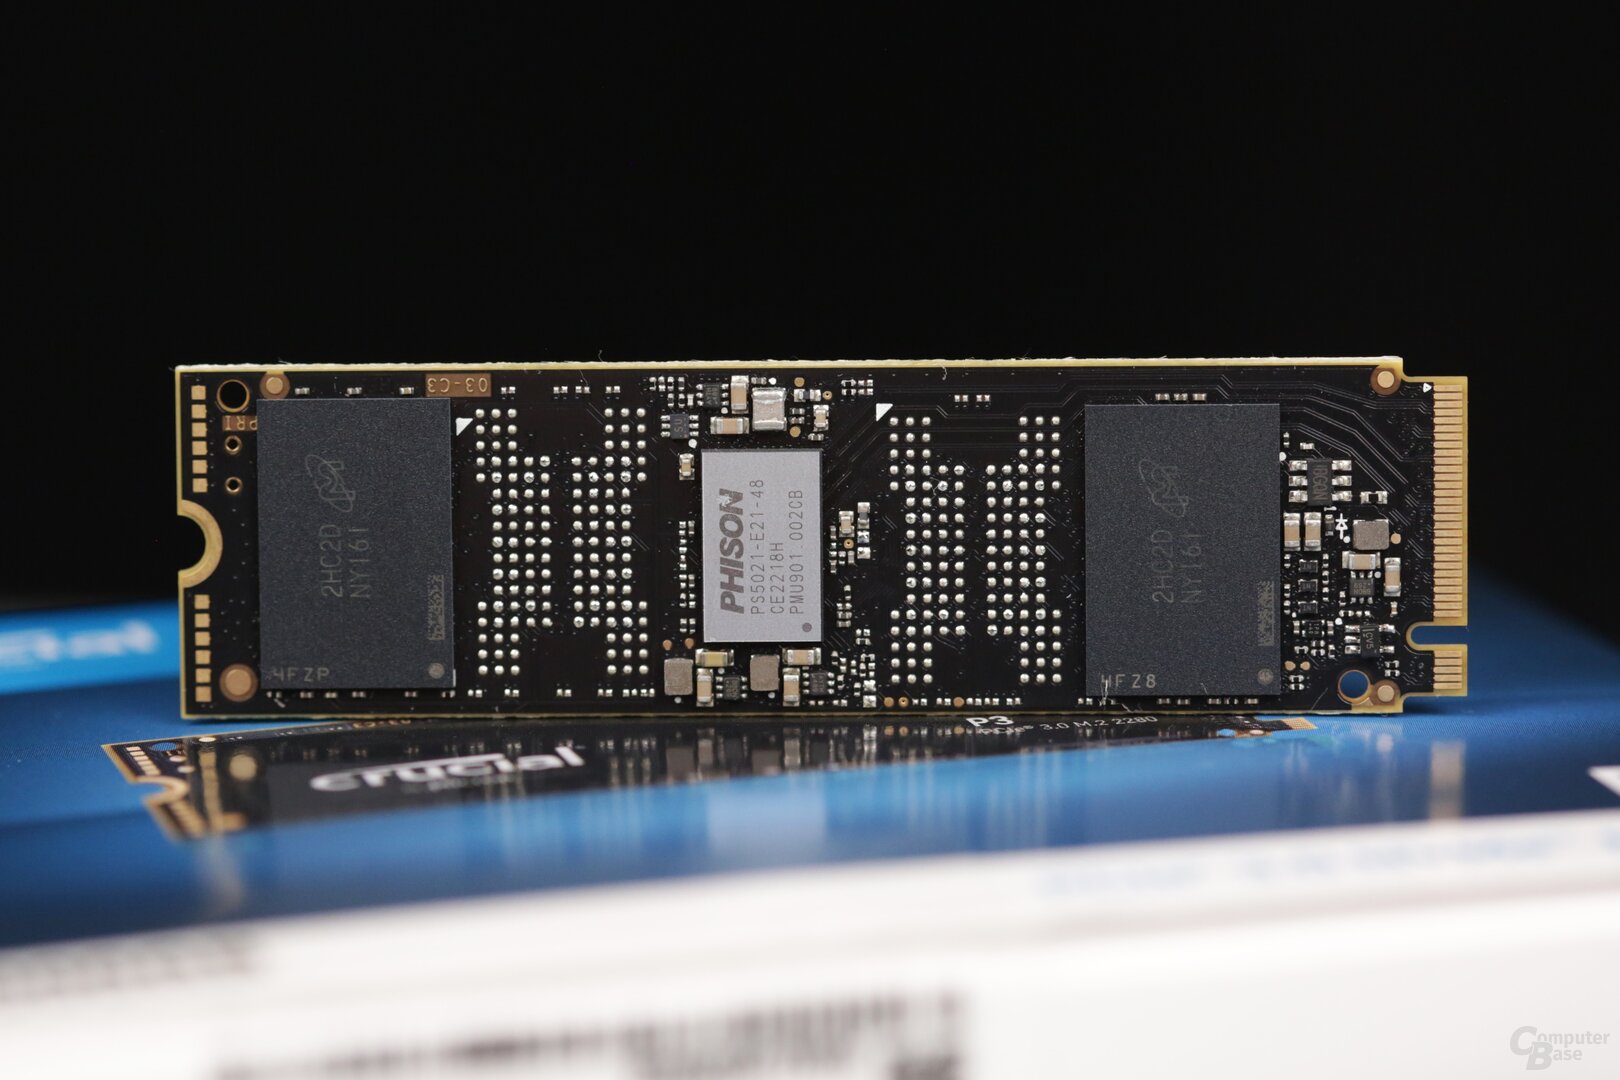
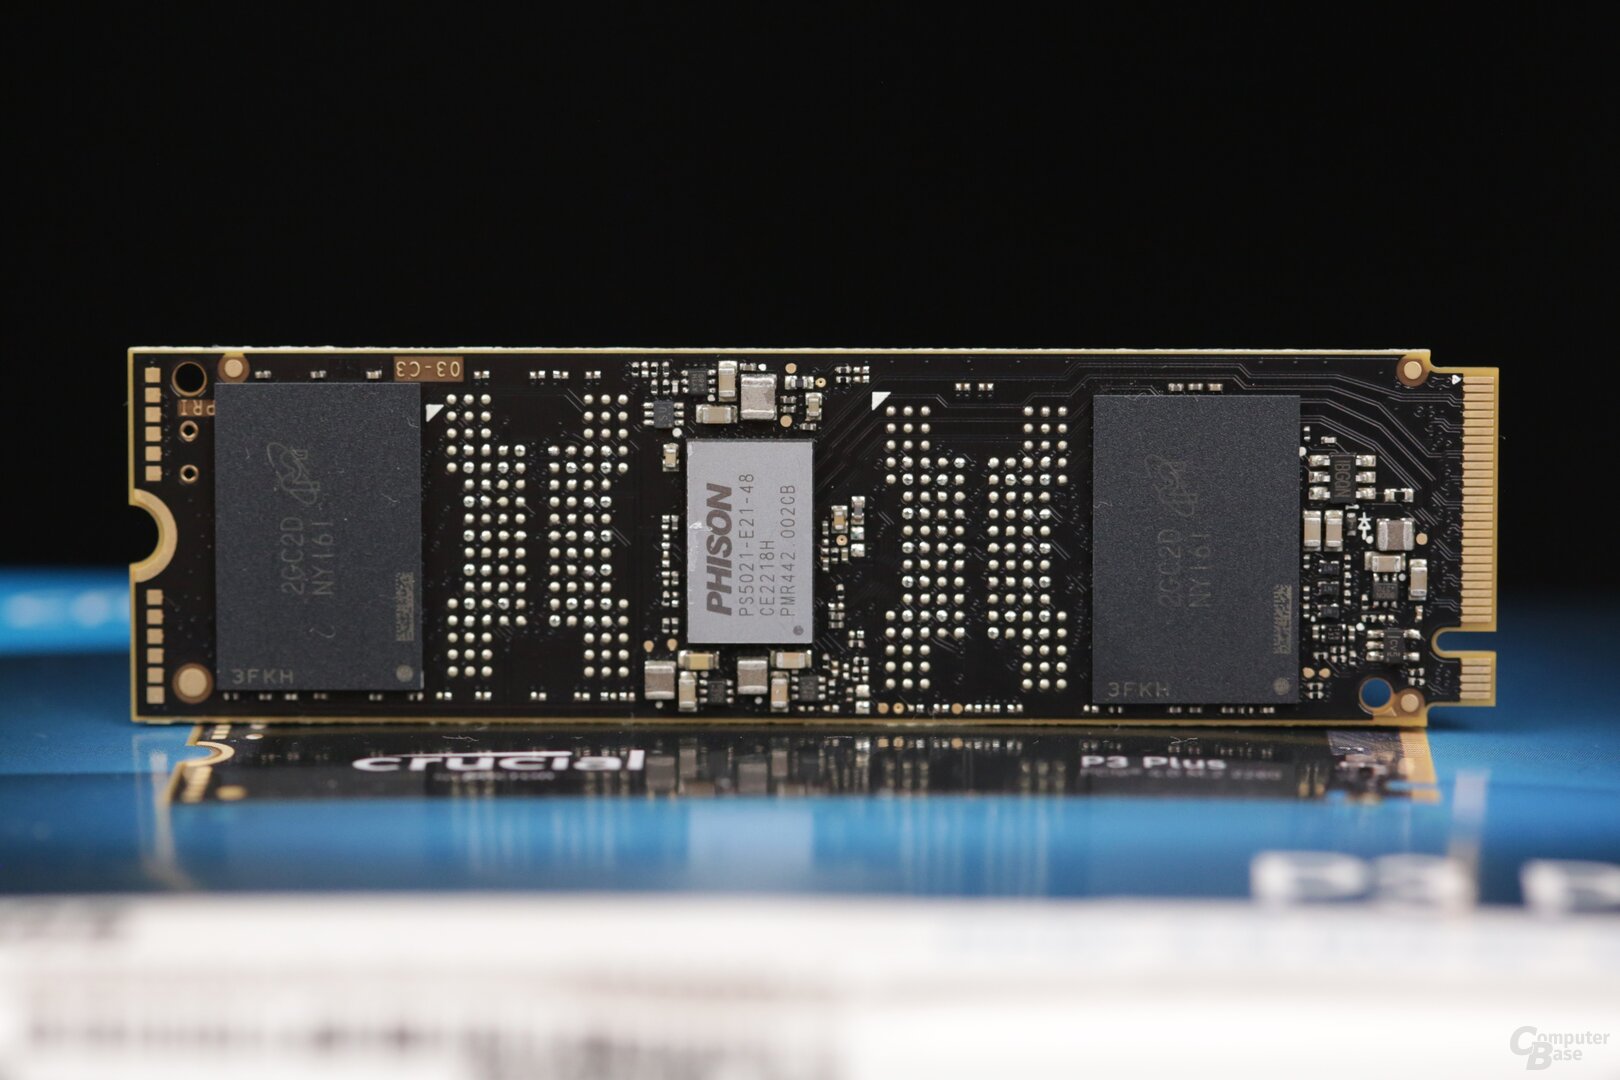
Both have the Phison E21 controller in the center of the board. Strictly speaking, it is the Phison E21T (PS5021-E21T), which the manufacturer itself lists under “coming soon” on the website. But there is already a data sheet (PDF) and the editors have known about the chip since CES 2021.
In the case of the test samples, each with 1 TB of usable storage space, there are only two NAND chips on the M.2 board, which is equipped on one side. Their identifier points to Micron's current QLC-NAND of the 176-layer generation, which is also called N48R internally. Although the identifiers on the P3 and P3 Plus differ slightly, only the five-digit code in the second line is relevant for identification via the Micron FBGA decoder and is identical here (NY161). When asked by the editors, Crucial has confirmed the 176-layer QLC NAND for both models.
Without the type sticker, the P3 and P3 Plus are practically indistinguishable and the technical basis is the same. Nevertheless, only the P3 Plus offers the full performance potential of the controller with a maximum of 5,000 MB/s for reading and 4,200 MB/s for writing (3,600 MB/s for the 1 TB model). The P3, on the other hand, is limited to PCIe 3.0 by the firmware and therefore only offers up to 3,500 MB/s, which corresponds to the practical limit of this interface.
Differences in detail
At the request of the editors, however, Crucial explained that there are not only differences in the firmware, but also in the hardware – and the direct comparison of the PCB seems to confirm this at selected positions with different assemblies. The idea of turning a P3 into a P3 Plus with a firmware update doesn't work, at least according to the manufacturer.
It is a change in both firmware and hardware. So, you cannot put Gen4 firmware on a Gen3 drive, or vice versa.
Crucial
This artificial limitation of performance, reminiscent of slimmed-down GPUs from graphics cards, is rare with SSD controllers. However, there have already been other examples, such as the Samsung 970 Evo Plus: Samsung brought this onto the market with a native PCIe 3.0 controller (codename Phoenix), but later in a new version of the 970 Evo Plus on the Elpis controller the Samsung 980 Pro with PCIe 4.0 changed.
The new Phison E21T controller
The E21T, the “T” at Phison stands for controller without dedicated DRAM cache, is a 4-channel controller for consumer SSDs. Like its predecessor, the E19T, it only has a single CPU core (ARM Cortex R5) and again no DRAM interface. Manufactured in 12 nm by TSMC, it should offer around 25 percent higher performance than its predecessor (28 nm) with the same reduced power consumption, Phison promised in the announcement. The package is comparatively small at just 7.5 × 12 mm. A Phison E18 with 8 channels and DRAM interface measures 12 × 12 mm and the older Phison E16 even measures 16 × 16 mm.
Nevertheless, with up to 5,000 MB/s and 800,000 IOPS, the E21T should be able to match the performance of the E16, which at the time marked the era of the first PCIe 4.0 SSDs. The test will show whether the reductions in cores (1 instead of 2) and DRAM will have a negative impact elsewhere. In any case, it is a cheaper and more economical heir.
Warranty and TBW compared
4-bit-per-cell QLC NAND is potentially not only slower, but also less durable than, say, 3-bit TLC-NAND. The write limit up to the loss of the otherwise 5-year warranty also takes this fact into account. The Total Bytes Written (TBW) are far below the values of SSDs with TLC-NAND. Crucial P3 and P3 Plus only offer a 220 TB write guarantee in the tested variant, while the Crucial P5 Plus with TLC has 600 TB.
After all, 220 TB means 5 years a daily write volume of around 120 GB. However, prolific writers should keep this in mind and are in the wrong place with QLC SSDs anyway, as the test will show.
Prices and key data at a glance
Currently, the Crucial P3 1 TB starts at 90 euros and the P3 Plus 1 TB available from 110 euros. In terms of price, the faster P5 Plus for 110 euros is a direct competitor.
Crucial P3 Crucial P3 Plus Crucial P5 Plus Controller: Phison PS5021-E21T, 4 NAND-Channel Micron, 8 NAND-Channel DRAM cache: none 1,024 MB LPDDR4 variant 2,048 MB LPDDR4 memory capacity: 500/1,000/2,000/4,000 GB 500/1,000/2,000 GB memory chips: Micron ? ? QLC (3D, 176 layers) NAND, 1024 Gbit Micron ? ? TLC (3D, 176 layers) NAND, ? Form factor: M.2 (80 mm) Interface: PCIe 3.0 x4 PCIe 4.0 x4 seq. read: 3,500 MB/s 4,700 MB/s variant5,000 MB/s variant4,800 MB/s 6,600 MB/s seq. write: 1,900 MB/svariant3000 MB/s 1900 MB/svariant3600 MB/svariant4200 MB/svariant4100 MB/s 3600 MB/svariant5000 MB/s 4K Random Read: ? 360,000 IOPS Variant630,000 IOPS Variant720,000 IOPS 4K Random Write: ? 100,000 IOPS Variant700,000 IOPS Power consumption Activity (typ.): ? Power consumption activity (max.): ? Power consumption idle: ? Power consumption DevSleep: ? Power consumption L1.2: ? Functions: NVMe, NCQ, TRIM, SMART, Garbage Collection Encryption: none TCG Opal 2.0 Total Bytes Written (TBW): 110 terabyte variant 220 terabyte variant 440 terabyte variant 800 terabyte 300 terabyte variant 600 terabyte variant 1,200 terabyte variant Warranty: 5 years Price: from 49 €/from 88 €/from €187/from €388 from €67/from €111/from €211/from €469 from €70/from €109/from €215 Price per GB: €0.10/€0.09/€0, 09/€0.10 €0.13/€0.11/€0.11/€0.12 €0.14/€0.11/€0.11
Test results and benchmarks
The following benchmarks were performed on a system with AMD Ryzen 7 3800X (test). M.2 SSDs are operated in the top M.2 slot of the Gigabyte Aorus X570 Master between AMD's Wraith Max cooler and an MSI Radeon R7 370. If the SSD itself does not have a cooler, the mainboard's is used.
The 120 mm fan in the rear and the two 140 mm fans in the inside ensure ventilation the front of the Fractal Design Meshify 2 Compact case. The fans in the front rotate at a constant 500 rpm, those in the rear and those of the CPU cooler at 900 rpm.
Windows 10 version 1909 with all current ones Updates are installed. Write caching is enabled.
As an exception to this rule, the Samsung Portable X5 SSD was run on a Razer Blade 15 2018 with an Intel Core i7-8750H (Windows 10 1909), which, unlike the AMD system, has a Thunderbolt 3 port. The write cache was also activated here.
Cache analysis (SLC mode)
ComputerBase tests how persistent the SLC mode is as follows: A compressed RAR file with a size of 10 GB is written from a RAM disk with a consecutive number in the file name to the empty test SSD without a break until the capacity limit is reached is green). The transfer rate achieved is logged for each copy process. Immediately after the last transfer, 50 percent of the files created are deleted, after which the SSD is allowed to rest for half an hour. Then it will be filled up again with the RAR files (orange), then 20 percent of the files will be deleted. After another 30-minute break, the third run takes place: Starting from a fill level of 80 percent, the SSD is filled again with the 10 GB RAR files (red). The test should determine the dependency of the SLC mode on the fill level of the SSD.
At least since Crucial confirmed the use of QLC-NAND, the editors were prepared for a low write rate after the SLC cache. But what the measurements then revealed resembles a disaster. The write rate drops to 70 MB/s, which doesn't even correspond to HDD levels. That's even slower than the very first QLC SSDs in the form of the Intel 660p and the Samsung 860 QVO (test). Is Micron's 176-layer NAND as slow in the QLC variant while the TLC version breaks records?
Charts
- Write by level performance (Crucial P3 1 TB)
- Write by level performance (Crucial P3 Plus 1 TB)
- Performance seq. write by level (Crucial P3 (Plus) 1 TB))
Performance Write by Level (Crucial P3 1 TB) 06001.2001.8002.4003.000Megabytes (MB) 15101520253035404550556065707580859096Level (x10 GB)
- Crucial P3 1TB – Empty
- Crucial P3 1TB – 50% full
- Crucial P3 1TB – 80% full
Performance Write by Level (Crucial P3 Plus 1 TB) 04008001.2001.6002.000Megabytes per second (MB/s) 15101520253035404550556065707580859096Fill Level (x10 GB)
- Crucial P3 1TB – empty
- Crucial P3 1TB – 50% full
- Crucial P3 1TB – 80% full
Performance seq. Write by level (Crucial P3 (Plus) 1 TB)) 01,0002,0003,0004,000Megabytes per second (MB/s) 150100150200250300350400450500550600seconds
- Crucial P3 1TB
- Crucial P3 Plus 1 TB
Since the P3 and P3 Plus use the same memory, both are also affected by this considerable writing weakness.
At first, however, users will not notice anything, because a quarter of the memory volume, i.e. 250 GB, can initially be written in fast SLC mode with only 1 bit per cell. After that, however, all QLC cells are written with one bit and must be written with four bits in QLC mode, which takes much longer.
The even bigger problem is that the memory cells are apparently not cleaned up again for SLC mode. Because even after long waiting times and formatting, the P3 SSDs stay on the low QLC level. It acts like a one-way SLC cache, after which writing is only carried out at a snail's pace when it is exhausted, because the SSD does not empty the cells written with 1 bit again, even during longer pauses, by consolidating its information with 4 bits in a quarter of the cells . With the P3 Plus, even formatting or formatting after deleting all partitions didn't help, while in this case the P3 was again able to write 250 GB quickly.
Charts
- Write by level performance (Crucial P3 & P3 Plus 1 TB)
- Crucial P3 Plus 1TB – by Format
- Crucial P3 Plus 1TB – by Diskpart Clean + Format
Performance Write by level (Crucial P3 & P3 Plus 1 TB) 06001.2001.8002.4003.000Megabytes per second (MB/s) 15101520253035404550556065707580859096level (x10 GB)
- .count:2″
- Crucial P3 1TB – Empty
- Crucial P3 1TB – 50% Full
- Crucial P3 1TB – 80% Full
- Crucial P3 Plus 1TB – Empty
- Crucial P3 Plus 1TB – 50% full
- Crucial P3 Plus 1TB – 80% full
- Crucial P5 1TB – empty
- Crucial P5 1 TB – 50% full
- Crucial P5 1TB – 80% full
- Crucial P5 Plus 1TB – Empty
- Crucial P5 Plus 1TB – 50% Full
- Crucial P5 Plus 1TB – 80% full
Crucial P3 Plus 1TB – by Format 04008001.2001.6002.000Megabytes per second (MB/s) 15101520253035404550556065707580859095Level (x10 GB)
- Crucial P3 Plus 1 TB – empty
Crucial P3 Plus 1 TB – after Diskpart Clean + Format 0100200300400500Megabytes per second (MB/s) 15101520253035404550556065707580859095.fill level (x10 GB)
- Crucial P3 Plus 1TB – empty
Copy processes in Explorer
- Red: NVMe SSDs (PCI Express 4.0 , M.2)
- Blue: NVMe SSDs (PCI Express 3.0, M.2)
- Green: External SSDs (USB, Thunderbolt)
- Orange : SATA SSDs (2.5 inch)
- Gray: SATA HDDs (3.5 inch)
Time required for full writing
- 0 to 100 percent
- 50 to 100 percent
- 80 to 100 percent
24 entries Time required for filling (0 to 100 percent)
- 250GB SSDs:
- SanDisk Ultra Plus 256 GB9:41
- 500GB SSDs:
- Samsung 980 Pro 500 GB8: 05
- Samsung 970 Evo Plus 500 GB8:55
- Kingston A1000 480GB13:57
- 1TB SSDs:
- PNY XLR8 CS3140 1 TB9:33
- Asus ROG Strix SQ7 1 TB9:56
- WD Black SN750 1 TB10:01
- WD Black SN850 1 TB10:40
- Adata XPG Gammix S70 Blade 1 TB11:44
- Adata XPG Gammix S70 1 TB13:03
- Corsair MP510 1 TB14:22
- SanDisk Extreme Pro Portable 1 TB V119:12
- Crucial P5 Plus 1 TB19:30
- Corsair MP600 1 TB20:03
- Adata XPX Legend 840 1 TB20:18
- SanDisk Extreme Portable 1 TB V226:49
- Samsung 980 1 TB29:09
- Samsung 870 Evo 1 TB34:30
- Crucial P5 1 TB34:57
- Kingston A2000 1 TB35:35
- Crucial MX500 1TB M3CR01036:27
- Crucial MX500 1TB M3CR03337:23
- Intel 670p 1 TB78:15
- Mushkin Delta 1 TB102:07
- Crucial P3 1 TB
strong>159:58
- Crucial P3 Plus 1TB162:48
- Samsung 870 QVO 1 TB193:37
- Patriot Supersonic Prime672:52
- Seagate FireCuda 530 2 TB17:42
- Samsung 980 Pro 2 TB17:56
- Corsair MP600 Pro XT 2 TB18:35
- Corsair MP600 Pro LPX 2 TB18:50
- Corsair MP600 Pro 2 TB19:40
- Mushkin Gamma 2 TB19:40
- HP FX900 Pro 2 TB20:35
- Patriot Viper VP4300 2TB27:16
- Patriot Viper VP4300 2TB 1.2A27 :43
- Kioxia Exceria Pro 2 TB35:07
- WD Blue SN550 2 TB41:30
- Corsair MP600 2 TB42:01
- Crucial P5 2 TB55:06
- Samsung Portable T7 Shield 2 TB57:39
- Corsair MP600 Core 2 TB120:31
- Crucial X6 Portable 2 TB317:05
- Crucial MX500 4 TB163:30
- Crucial X6 Portable 4 TB892:31
- Seagate FireCuda Gaming HDD 5 TB776:24
Unit: minutes, seconds 23 entries Time required for full write (50 to 100 percent)
- 250 GB SSDs (approx. 125 GB write volume):
- SanDisk Ultra Plus 256 GB5:31
- 500 GB SSDs (approx. 250 GB write volume):
- Samsung 980 Pro 500 GB4:05
- Samsung 970 Evo Plus 500 GB4:46
- Kingston A1000 480 GB7:27
- 1 TB SSDs (approx. 500 GB write volume):
- WD Black SN750 1 TB5:13
- WD Black SN850 1 TB5:23
- Asus ROG Strix SQ7 1 TB5:55
- PNY XLR8 CS3140 1 TB5:58
- Adata XPG Gammix S70 1 TB6:49
- Adata XPG Gammix S70 Blade 1 TB7:13
- Corsair MP510 1 TB7:14
- Corsair MP600 1TB9:43
- SanDisk Extreme Pro Portable 1 TB V19:52
- Crucial P5 Plus 1 TB10:11
- Adata XPX Legend 840 1 TB11:37
- SanDisk Extreme Portable 1 TB V213:53
- Samsung 980 1 TB16:57
- Crucial P5 1 TB16:59
- Samsung 870 Evo 1 TB18:12
- Kingston A2000 1 TB19:28
- Crucial MX500 1TB M3CR01020:37
- Crucial MX500 1TB M3CR03320:41
- Intel 670p 1TB40:44
- Mushkin Delta 1 TB66:02
- Samsung 870 QVO 1 TB99:03
- Crucial P3 1 TB< /strong>108:48
- Crucial P3 Plus 1TB112:48
- Patriot Supersonic Prime427:10
li>
li>
- 2 -TB SSDs (approx. 1 TB write volume):
- Corsair MP600 Pro XT 2 TB9:13
- Samsung 980 Pro 2 TB9:52
- Corsair MP600 Pro LPX 2 TB9: 52
- Seagate FireCuda 530 2 TB10:01
- HP FX900 Pro 2 TB10:35
- Corsair MP600 Pro 2 TB10:50
- Mushkin Gamma 2 TB11:00
- Patriot Viper VP4300 2TB 1.2A14: 56
- Kioxia Exceria Pro 2 TB19:13
- Corsair MP600 2 TB20:46
- WD Blue SN550 2 TB20:47
- Crucial P5 2 TB31:01
- Samsung Portable T7 Shield 2 TB41:22
- Corsair MP600 Core 2 TB76:08
- 4 TB SSDs (approx. 2 TB write volume):
- Crucial MX500 4 TB90:05
- Crucial X6 Portable 4 TB561:41
Unit: minutes, seconds 23 entries Time required for full writing (80 to 100 percent)
- 250-GB -SSDs (approx. 50 GB writing volume):
- SanDisk Ultra Plus 256 GB2:36
- 500 GB SSDs (approx. 100 GB write volume):
- Samsung 980 Pro 500 GB1:28
- Samsung 970 Evo Plus 500 GB1:58
- Kingston A1000 480 GB2:54
- 1 TB SSDs (approx. 200 GB write volume):
- WD Black SN750 1 TB2:02
- WD Black SN850 1 TB2:15
- Adata XPG Gammix S70 1 TB2:29
- PNY XLR8 CS3140 1 TB2:39
- Adata XPG Gammix S70 Blade 1 TB2:43
- Asus ROG Strix SQ7 1 TB2:51< /li>
- Corsair MP510 1 TB2:54
- Crucial P5 Plus 1 TB3:32
- Corsair MP600 1 TB3:40
- Adata XPX Legend 840 1 TB4:00
- SanDisk Extreme Pro Portable 1TB V14:01
- SanDisk Extreme Pro Portable 1TB V25:36
- Crucial P5 1 TB6:30
- Samsung 980 1 TB6:45
- Kingston A2000 1 TB6:49
- Samsung 870 Evo 1 TB7:17
- Crucial MX500 1 TB M3CR0338:05
- Crucial MX500 1TB M3CR0108:14
- Intel 670p 1TB14:53
< li class="chart__row">Patriot Supersonic Prime15:34
- Mushkin Delta 1 TB25:16
- Crucial P3 Plus 1TB 39:37
- Samsung 870 QVO 1TB39:38
- Crucial P3 1TB41 :01
- Samsung 980 Pro 2 TB3:19
- Corsair MP600 Pro XT 2 TB3:38
- Seagate FireCuda 530 2 TB3:45
- Corsair MP600 Pro LPX 2 TB3:49
- HP FX900 Pro 2 TB4:08
- Corsair MP600 Pro 2 TB4:43
- Mushkin Gamma 2 TB4:46
- Patriot Viper VP4300 2 TB5:29
- Kioxia Exceria Pro 2 TB6:01
- Patriot Viper VP4300 2TB 1.2A6:12
- Corsair MP600 2TB7:16
- WD Blue SN550 2TB8:03
- Crucial P5 2 TB11:13
- Samsung Portable T7 Shield 2 TB12:08
- Corsair MP600 Core 2 TB31:19
- Crucial X6 Portable 2 TB61:55
li>
- Crucial MX500 4 TB35:16
- Crucial X6 Portable 4 TB234:14
Unit: minutes, seconds
The measurements for the time required to fill the SSD are also underground. The fact that the Crucial P3 and P3 Plus are sometimes beaten by a Samsung 870 QVO with a SATA interface is an indictment. Even the Mushkin Delta (test) with QLC and PCIe 4.0, which writes leisurely for its class, easily outperforms the P3 series.
Copying 50 entries from the SSD
- 10GB .rar to RAM disk:
- WD Black SN850 1TB2.116 ,80
- Corsair MP600 Pro XT 2 TB2.112,29
- Corsair MP600 Per LPX 2 TB2,088.10
- Patriot Viper VP4300 2TB2064.84
- Adata XPX Legend 840 1TB2050, 20
- HP FX900 Pro 2 TB2037.30
- Corsair MP600 1 TB2 .034.85
- Adata XPG Gammix S70 Blade 1 TB2.027.55
- Corsair MP600 Pro 2 TB2027.47
- Seagate FireCuda 530 2 TB2025.98
- PNY XLR8 CS3140 1 TB2,024.20
- Kioxia Exceria Pro 2 TB2,000.30
- Samsung 970 Evo Plus 500 GB1,961.20
- Adata XPG Gammix S70 1 TB1,954.58
- Mushkin Gamma 2 TB1,943.00
- Corsair MP510 1 TB1,932.02
- Samsung 980 Pro 2TB1,928.00
- Patriot Viper VP4300 2TB 1.2A1,916.90
- Samsung 980 Pro 500 GB1,876.80
- Asus ROG Strix SQ7 1 TB1,803, 90
- WD Black SN750 1 TB1,802.52
- Corsair MP600 Core 2 TB1,795.35
- Crucial P5 Plus 1 TB1,787.01
- Corsair MP600 2 TB1,758.00
- Intel 670p 1 TB1,743.50
- Samsung 980 1 TB1,693.07
- WD Blue SN550 2 TB1,567.80
- Crucial P5 2TB1,547.80
- Mushkin Delta 1TB1,514.60
- Crucial P5 1TB1,499.00
- Kingston A2000 1 TB1,491.20
- Kingston A1000 480 GB956.90
- Crucial P3 Plus 1 TB956.33
- Crucial P3 1 TB941, 70
- SanDisk Extreme Portable 1 TB V2825,20
- Samsung Portable T7 Shield 2 TB725,40
- SanDisk Extreme Pro Portable 1 TB V1701.25
- Crucial X6 Portable 2TB497.08
- Crucial MX500 1TB M3CR033494.62
- Samsung 870 Evo 1TB494.00
- Crucial MX500 1TB M3CR010491,66
- SanDisk Ultra Plus 256 GB475.15
- Samsung 870 QVO 1 TB461.90
- Crucial MX500 4TB450.00
- Patriot P210 2TB (2nd pattern)441.44
- Crucial X6 Portable 4 TB379.70Note the information in the text
- Patriot Supersonic Prime244.40
- Seagate FireCuda Gaming HDD 5 TB141,20
li>
li>
- 23 GB Steam folder to RAM disk:
- PNY XLR8 CS3140 1 TB2,095.80< /li>
- HP FX900 Pro 2TB2,078.50
- Corsair MP600 Pro LPX 2 TB2,061.50
- Kioxia Exceria Pro 2 TB2,045.50
- Adata XPX Legend 840 1 TB2035.37
- Corsair MP600 Pro XT 2 TB2012.92
< li class="chart__row chart__row--hidden toggle-body-item nojs-tr">Adata XPG Gammix S70 Blade 1 TB2003,26
- Seagate FireCuda 530 2 TB1980, 50
- Adata XPG Gammix S70 1 TB1,965.24
- Corsair MP600 Pro 2 TB1,955.35
- Crucial P5 Plus 1 TB1,932.52
- Samsung 980 Pro 2 TB1,931.43
- Mushkin Gamma 2 TB1,926.00
- Patriot Viper VP4300 2 TB1,924.21
- WD Black SN850 1 TB1,912.26
- Corsair MP600 1 TB1,867.22< /li>
- Patriot Viper VP4300 2TB 1.2A1,861.20
- Samsung 980 Pro 500 GB1,839.60
- Corsair MP600 Core 2 TB1,765.20
- Asus ROG Strix SQ7 1 TB1,762.90
- Intel 670p 1TB1,699.50
- Crucial P5 2TB1,680.91
- Corsair MP510 1TB1,680.59
- WD Black SN750 1TB1,647.03
- Samsung 970 Evo Plus 500 GB1,637.70
- Crucial P5 1 TB1,615.00
- Corsair MP600 2 TB1,602.00
- Samsung 980 1TB1,600.82
- Mushkin Delta 1TB1,450.00
- Kingston A2000 1TB1,389.83
- WD Blue SN550 2TB1,377.40
- Crucial P3 1TB954.50
- Crucial P3 Plus 1TB951.00
- Kingston A1000 480 GB885.65
- SanDisk Extreme Portable 1 TB V2814.80
- Samsung Portable T7 Shield 2 TB719,80
- SanDisk Extreme Pro Portable 1 TB V1678,19
- Crucial X6 Portable 4 TB513,80
- Crucial X6 Portable 2 TB483.20
- Crucial MX500 1 TB M3CR010481.49
- Crucial MX500 1 TB M3CR033480.97
- Samsung 870 Evo 1 TB472.00
- Patriot P210 2TB (2nd sample)460.81
- Samsung 870 QVO 1 TB451.70
- Crucial MX500 4 TB448.73
- SanDisk Ultra Plus 256 GB444.15
- Patriot Supersonic Prime201,40
- Seagate FireCuda Gaming HDD 5 TB138,12
li>
Unit: megabytes per second (MB/s)
But the P3 (Plus) does not only reveal massive weaknesses when writing. Both are by far among the slowest NVMe SSDs in the test field when it comes to practical reading and subsequent writing to the RAM disk. 1,000 MB/s are not achieved and thus only an old Kingston A1000 is caught up, while the top field acts more than twice as fast. Intel's 670p, which also uses QLC-NAND, is around 80 percent faster.
As a third copy test, the editors duplicated a 195 GB Steam folder with five installed games on the SSD. The chart below shows the mean value from five runs.
50 entries copied to the SSD, 195 GB Steam games
- < li class="chart__group"> Duration:
- HP FX900 Pro 2 TB100.0
- Corsair MP600 Pro XT 2 TB102,1
- Corsair MP600 Pro LPX 2 TB103,8
- Seagate FireCuda 530 2 TB104,3
- Patriot Viper VP4300 2 TB104,4
- Kioxia Exceria Pro 2 TB105,5
- Mushkin Gamma 2 TB107,7
- Patriot Viper VP4300 2 TB 1.2A110, 0
- Samsung 980 Pro 2 TB110,3
- Adata XPG Gammix S70 Blade 1 TB118.5
- Adata XPX Legend 840 1 TB118.8
- Adata XPG Gammix S70 1 TB121.1
- WD Black SN850 1 TB131,8
- PNY XLR8 CS3140 1 TB143,5
- Corsair MP600 1 TB147.0
- Corsair MP600 2 TB150.0
- Corsair MP600 Core 2 TB151.8
- Asus ROG Strix SQ7 1 TB153.1
- Crucial P5 Plus 1 TB209,7
- Crucial P5 2 TB227,6
- Samsung 980 Pro 500 GB248.6
- Crucial P5 1 TB292.0
- Samsung 970 Evo Plus 500 GB321,7
- Samsung 980 1 TB358,2
- Corsair MP510 1 TB368,7
- Kingston A2000 1TB377.5
- SanDisk Extreme Pro Portable 1 TB V1479.8
- Intel 670p 1 TB519.0
- Mushkin Delta 1 TB536.0
- Kingston A1000 480 GB538.0
- Crucial X6 Portable 4 TB659.5
- SanDisk Extreme Portable 1 TB V2690.0
- Samsung 870 Evo 1 TB929.5
- Crucial MX500 1TB M3CR010992.0
- Crucial MX500 1TB M3CR0331.006.0< /li>
- Crucial MX500 4 TB1050.0
- Patriot P210 2TB (2nd Sample)1154.4
- Crucial P3 Plus 1TB2117.0
- Crucial P3 1 TB2,141.0
- Crucial X6 Portable 2 TB2,289.0
- Samsung 870 QVO 1 TB2,773.0
- Crucial BX200 480 GB2,988, 5
- Seagate FireCuda Gaming HDD 5 TB4,780.0
- Patriot Supersonic Prime7,739.0
- Transfer rate (average):
- HP FX900 Pro 2 TB2,001.6
- Corsair MP600 Pro XT 2 TB1,960.0
- Corsair MP600 Pro LPX 2 TB1,928.7
- Seagate FireCuda 530 2TB1918.8
- Patriot Viper VP4300 2TB1917.5
- Kioxia Exceria Pro 2TB1896.7
- Mushkin Gamma 2 TB1,860.0
- Corsair MP600 Pro 2 TB1,845.1
- Patriot Viper VP4300 2 TB 1.2A1,818.7
- Samsung 980 Pro 2 TB1814.3
- Adata XPG Gammix S70 Blade 1 TB1,688.2
- Adata XPX Legend 840 1 TB1,684.0
- Adata XPG Gammix S70 1 TB1,651.8
- WD Black SN850 1 TB1,528.8
- PNY XLR8 CS3140 1 TB1,393.9
- Corsair MP600 1 TB1.361,5
- Corsair MP600 2 TB1334.0
- Corsair MP600 Core 2 TB1318.4
- Asus ROG Strix SQ7 1 TB1. 307.0
- WD Black SN750 1 TB1,092.9
- Crucial P5 Plus 1 TB954.1
- Crucial P5 2 TB879,4
- Samsung 980 Pro 500 GB804.7
- Crucial P5 1 TB684.0
< li class="chart__row">WD Blue SN550 2 TB680,2
- Samsung 970 Evo Plus 500 GB622,1
- Samsung 980 1 TB562,3
- Corsair MP510 1 TB542,7
- Kingston A2000 1TB530.5
- SanDisk Extreme Pro Portable 1TB V1417.1
- Intel 670p 1TB393.0
- Mushkin Delta 1 TB374.0
- Kingston A1000 480 GB371.8
- Crucial X6 Portable 4 TB303.5
- SanDisk Extreme Portable 1 TB V2286,3
- Samsung 870 Evo 1 TB215,3
- Crucial MX500 1TB M3CR010201,7
- Crucial MX500 1TB M3CR033198,8
- Crucial MX500 4 TB190,6
- Patriot P210 2TB (2nd Sample)173.4
- Crucial P3 Plus 1TB94.5
- Crucial P3 1 TB93.5
- Crucial X6 Portable 2 TB87.5
- Samsung 870 QVO 1 TB72.3
- Crucial BX200 480 GB67.0
- Patriot Supersonic Prime25.9
< li class="chart__row">WD Black SN750 1 TB183,1
< li class="chart__row">WD Blue SN550 2 TB294,2
< li class="chart__row chart__row--hidden toggle-body-item nojs-tr">Samsung Portable T7 Shield 2 TB616,5
li>
Unit: seconds
< li class="chart__row chart__row--hidden toggle-body-item nojs-tr">Samsung Portable T7 Shield 2 TB324,6
< li class="chart__row chart__row--hidden toggle-body-item nojs-tr">Seagate FireCuda Gaming HDD 5 TB41.9
Unit: Megabytes per second (MB/s)
When the P3 (Plus) fails in both writing and reading, it doesn't take much imagination to guess the result when duplicating files on the SSD with parallel reading and writing. The new Crucial SSDs take over half an hour to duplicate the 195 GB Steam folder. The Intel 670p doesn't need 10 minutes for this and the high-end bolides do it in about 100 seconds.
Performance consistency in PCMark 10
h3> Explanations of the PCMark 10 tests
With a typical runtime of 10 to 20 hours, or more than a day for slow or particularly large drives, the Drive Performance Consistency Test measures the performance consistency under extreme continuous load, which is more in line with professional use. According to the developer, the data volume in the test is 23 TB plus up to three times the storage capacity of the data carrier.
First, the data carrier is “prepared” by being almost completely filled with random data and then written to again. After that, further write loads are carried out alternately in several phases, followed by so-called trace tests, which use recorded traces of file transfers in applications. The aim is to determine how severe the performance drop that is typical for NAND flash-based SSDs is under continuous load, and to achieve the so-called “steady state” with constant but low performance. Finally, the data medium is given a break and then the performance in the trace tests is determined again to see how the drive “recovers”.
The trace Tests are as follows:
- Using Adobe After Effects
- Using Adobe InDesign
- Using Adobe Photoshop (heavy use)
- Copying 4 ISO image files, 20 GB in total, from an secondary drive to the target drive (write test)
- Making a copy of the ISO files (read-write test)
- Copying 339 JPEG files, 2.37 GB in total, in to the target drive (write test)
- Making a copy of the JPEG files (read-write test)
The Quick System Drive benchmark is significantly shorter. With a smaller range of six recorded tracks (traces) and only 23 GB of data, the test lasts around 20 minutes and is intended to reflect lighter everyday tasks. The preparatory description is omitted. The scenario ranges from writing, reading and duplicating image files to using Adobe Illustrator and Photoshop to Microsoft Excel.
- Copying 339 JPEG files, 2.37 GB in total, in to the target drive (write test)
- Making a copy of the JPEG files ( read-write test)
- Copying the JPEG files to another drive (read test)
- Using Microsoft Excel
- Using Adobe Illustrator
- Using Adobe Photoshop (light use)
But there is still light in all the shadows: In the fast System Drive benchmark of PCMark 10, both P3 models from Crucial break the 3,000 point mark, which only a few manage to do. Crucial and its firmware is obviously particularly strong here, as the Crucial P5 is already the front runner.
Charts
- PCMark10 Quick System Drive Benchmark
- PCMark10 Drive Performance Consistency
96 entries PCMark10 Quick System Drive Benchmark
- points:
- < li class="chart__row">Crucial P5 Plus 1 TB3,644.0
- WD Black SN850 1 TB3,542.0
- HP FX900 Pro 2 TB3,467.0
- Patriot Viper VP4300 2 TB3,379.0
- Adata XPG Gammix S70 Blade 1 TB3279.0
- Seagate FireCuda 530 2 TB3239.0
- PNY XLR8 CS3140 1 TB3,178.0
- Crucial P3 Plus 1 TB3,158.0
- Corsair MP600 Pro XT 2 TB3121.0
- Corsair MP600 Pro LPX 2 TB3100.0
- Crucial P3 1TB3,029.0
- Asus ROG Strix SQ7 1 TB2,985.0
- Samsung 980 Pro 500GB2,961.0
- Patriot Viper VP4300 2TB 1.2A2,932.0
- Samsung 980 Pro 1 TB2,919.0
- Samsung 980 Pro 2 TB2,892.0
- Corsair MP600 1 TB2,854.0
- Corsair MP600 2 TB2,843.0
- Adata XPX Legend 840 1TB2,795.0
- Kioxia Exceria Pro 2TB2,724.0
- Corsair MP510 1TB2. 724.0
- Intel 670p 1TB2697.0
- Adata XPG Gammix S70 1TB2636.0
- Samsung 980 1 TB2,607.0
- Mushkin Gamma 2 TB2586.0
- Mushkin Delta 1 TB2573.0
- Corsair MP600 Core 2 TB2228.0
- Crucial P5 2 TB2013.0
- Kingston A2000 1TB2006.0
- Crucial P5 1 TB1,959.0
- WD Blue SN550 2 TB1,793.0
- Samsung 970 Evo Plus 500 GB1,520.0
- Samsung 870 Evo 2 TB1,387.0
- Samsung 870 Evo 1 TB1,373.0
- WD Black SN750 1 TB1,368.0
- Samsung 870 QVO 1TB1,298.0
- SanDisk Extreme Portable 1 TB V21.098.0
- Crucial X8 Portable 1TB1094.0
- Crucial MX500 1TB M3CR010988.0
- Patriot P2xx 2TB (1st sample)969.0
- Crucial MX500 1TB M3CR033947.0< /li>
- Crucial MX500 4 TB911,0
- Patriot P210 2TB (2nd Sample)900.0
- SanDisk Extreme Pro Portable 1TB V1861.0
- Samsung Portable T7 Shield 2 TB665.0
- SanDisk Ultra Plus 256 GB658.0
- Crucial X6 Portable 2 TB653.0
- Seagate Exos X18 TB487.0
- Crucial X6 Portable 4 TB476.0
- Patriot Supersonic Prime450.0
- WD Red 6TB (WD60EFRX)333.0
- Synology HAT5300-8T305.0
- Seagate IronWolf 4TB (ST400VN008)145.0
- Seagate FireCuda Gaming HDD 5 TB127.0
li>
< li class="chart__row chart__row--hidden toggle-body-item nojs-tr">Corsair MP600 Pro 2 TB2,633.0
< li class="chart__row chart__row--hidden toggle-body-item nojs-tr">Kingston A1000 480 GB793.0
Unit: points
- Crucial P5 Plus 1 TB443,3
- WD Black SN850 1 TB430,9
- HP FX900 Pro 2 TB424,4
- Patriot Viper VP4300 2 TB413.8
- Adata XPG Gammix S70 Blade 1 TB399.9
- Seagate FireCuda 530 2 TB390,3
- PNY XLR8 CS3140 1 TB385,5
- Corsair MP600 Pro XT 2 TB381,1
- Crucial P3 Plus 1 TB380.6
- Corsair MP600 Pro LPX 2 TB375.8
- Crucial P3 1 TB367, 6
- Corsair MP600 1 TB367,1
- Patriot Viper VP4300 2TB 1.2A360,9
- Asus ROG Strix SQ7 1 TB359.0
- Samsung 980 Pro 2 TB351.1
- Samsung 980 Pro 1 TB349.6
- Corsair MP600 2 TB347.0
- Adata XPX Legend 840 1 TB342.7
- Intel 670p 1 TB333.1
- Corsair MP510 1 TB332.7
- Kioxia Exceria Pro 2 TB332.7
- Adata XPG Gammix S70 1 TB324.7
- Corsair MP600 Pro 2 TB324.1
- Mushkin Gamma 2 TB319,1
- Samsung 980 1 TB317.7
- Mushkin Delta 1 TB315.7
- Corsair MP600 Core 2 TB274.6
- Samsung 980 Pro 500 GB259.7
- Kingston A2000 1 TB249.5
li>
< li class="chart__row chart__row--hidden toggle-body-item nojs-tr">Crucial P5 2 TB247,4
Unit: Megabytes per second (MB/s)
- Crucial P5 Plus 1 TB35.0
- WD Black SN850 1 TB36.0
- HP FX900 Pro 2 TB37,0
- Patriot Viper VP4300 2 TB38,0
- Adata XPG Gammix S70 Blade 1 TB39.0
- Seagate FireCuda 530 2 TB39.0
- Crucial P3 Plus 1 TB
strong>40.0
< li class="chart__row chart__row--hidden toggle-body-item nojs-tr">Kingston A1000 480 GB167.0
Unit: microseconds (µs)
57 entries PCMark10 Drive Performance Consistency
- Points:
- Seagate FireCuda 530 2TB2457.0
- Corsair MP600 Pro LPX 2TB2392.0
- Corsair MP600 Pro XT 2 TB2,168.0
- Samsung 980 Pro 1 TB2,097.0
- Samsung 980 Pro 2 TB1,935.0
- HP FX900 Pro 2 TB1,527.0
- WD Black SN850 1TB1,402.0
- Crucial P5 Plus 1TB1,383.0
- Samsung 980 Pro 500 GB1,275.0
- Mushkin Gamma 2 TB1181.0
- Asus ROG Strix SQ7 1 TB1150.0
- PNY XLR8 CS3140 1 TB1,135.0
- WD Blue SN550 2 TB1,133.0
- Corsair MP510 1 TB1114.0
- Corsair MP600 1 TB1078.0
- Kioxia Exceria Pro 2 TB1022.0
- Samsung 970 Evo Plus 500 GB943.0
- Crucial P5 2 TB856.0
- Samsung 870 Evo 2 TB809.0
- Kingston A2000 1 TB801.0
- Adata XPG Gammix S70 Blade 1 TB786.0
- WD Black SN750 1 TB783.0
- Adata XPG Gammix S70 1 TB766.0
- Crucial P5 1 TB694.0
- Patriot Viper VP4300 2 TB688.0
- Crucial MX500 1TB M3CR010576.0
- Crucial MX500 1TB M3CR033568.0
- Adata XPX Legend 840 1TB563.0
- Patriot Viper VP4300 2TB 1.2A486.0< /li>
- Intel 670p 1 TB462.0
- Samsung 980 1 TB390.0
- Corsair MP600 Core 2 TB374.0
- Samsung 870 QVO 1 TB368.0
- Kingston A1000 480 GB347.0
- Mushkin Delta 1 TB256.0
- SanDisk Ultra Plus 256GB240.0
- Patriot P210 2TB (2nd sample)223.0
Unit: points
- Transfer rate:
- Seagate FireCuda 530 2 TB575.7
- Corsair MP600 Pro LPX 2 TB562.0
- Corsair MP600 Pro XT 2 TB506.8
- Samsung 980 Pro 1 TB486.5
- Samsung 980 Pro 2 TB453.8
- HP FX900 Pro 2 TB360.9
- WD Black SN850 1 TB333.8
- Crucial P5 Plus 1 TB332.3
li>
li>
< li class="chart__row chart__row--hidden toggle-body-item nojs-tr">Samsung 980 Pro 500 GB300.8
- Mushkin Gamma 2 TB276.7
- WD Blue SN550 2 TB270.9
- Asus ROG Strix SQ7 1 TB267.6
- PNY XLR8 CS3140 1 TB264,6
- Corsair MP510 1 TB261,7
- Corsair MP600 1 TB249,4
- Kioxia Exceria Pro 2 TB242.1
- Samsung 970 Evo Plus 500 GB224.9
- Crucial P5 2 TB200,7
- Kingston A2000 1 TB200,7
- Samsung 870 Evo 2 TB197.0
- Adata XPG Gammix S70 Blade 1 TB189.0
- WD Black SN750 1 TB187.5
- Adata XPG Gammix S70 1 TB181.5
- Crucial P5 1TB164.9
- Patriot Viper VP4300 2 TB164,2
- Crucial MX500 1TB M3CR010145.9
- Crucial MX500 1TB M3CR033144.5
- Adata XPX Legend 840 1TB140.8
- Intel 670p 1 TB119.6
- Patriot Viper VP4300 2 TB 1.2A116.9
- Samsung 980 1 TB99.7
- Samsung 870 QVO 1 TB96.0
- Corsair MP600 Core 2 TB94.5
- Kingston A1000 480 GB90,2
- Patriot P2xx 2 TB (1st pattern)71,3
- Mushkin Delta 1 TB65,1
- SanDisk Ultra Plus 256GB62.9
- Patriot P210 2TB (2nd pattern)57.9
< li class="chart__row chart__row--hidden toggle-body-item nojs-tr">Corsair MP600 Pro 2 TB266,1
li>
Unit: megabytes per second (MB/s)
- Seagate FireCuda 530 2 TB100.0
- Corsair MP600 Pro LPX 2 TB103.0
- Corsair MP600 Pro XT 2 TB113.0
- Samsung 980 Pro 1 TB116.0
- Samsung 980 Pro 2 TB127.0
- HP FX900 Pro 2 TB162.0
- WD Black SN850 1 TB178.0
- Crucial P5 Plus 1 TB182.0
- Samsung 980 Pro 500 GB194.0
- Mushkin Gamma 2 TB208.0
< li class="chart__row">Asus ROG Strix SQ7 1 TB212.0
< li class="chart__row chart__row--hidden toggle-body-item nojs-tr">Corsair MP600 1 TB225.0
< li class="chart__row chart__row--hidden toggle-body-item nojs-tr">Kingston A1000 480 GB781.0
Unit: Microseconds (µs)
< p class="p text-width">Due to time constraints, the editors have dispensed with the extremely lengthy consistency test. Based on the previous measurements, a result on par with the slow SATA SSD 870 QVO would not be too surprising.
CrystalDiskMark
< p class="p text-width">The Crucial P3 and P3 Plus master the minimum program, namely at least reaching the manufacturer's specifications in the synthetic benchmark, without any problems. However, the previous practical tests have shown once again that these test programs are far from sufficient to really be able to assess the performance of an SSD. The glaring weaknesses don't even come to light here.
CrystalDiskMark 7.0.0
- Read
- Write
124 entries CrystalDiskMark 7.0.0 (Read)
- Sequential (1MiB/Q8T1):
- Adata XPG Gammix S70 Blade 1 TB7480.2
- Adata XPG Gammix S70 1 TB7478.2
- Patriot Viper VP4300 2 TB7,475.7
- HP FX900 Pro 2 TB7,474.4
- PNY XLR8 CS3140 1 TB7.388.5
- Asus ROG Strix SQ7 1 TB7383.8
- Kioxia Exceria Pro 2 TB7379.3
- Seagate FireCuda 530 2 TB7358 ,3
- Corsair MP600 Pro XT 2 TB7,334.5
- Corsair MP600 Pro LPX 2 TB7,329.4
- Corsair MP600 Pro 2 TB7,173.9
- Mushkin Gamma 2 TB7159.4
- WD Black SN850 1 TB7021.4
- Crucial P5 Plus 1 TB6852.9
- Samsung 980 Pro 2 TB6,790.9
- Samsung 980 Pro 500 GB6,775.9
- Samsung 980 Pro 1 TB6,609.6
- < strong>Crucial P3 Plus 1TB5154.8
- Adata XPX Legend 840 1 TB5035.9
- Corsair MP600 2 TB5013.7
- Corsair MP600 1 TB4992.7
- Corsair MP600 Core 2 TB4947.8
< li class="chart__row">Mushkin Delta 1TB4,697.6
- Crucial P3 1TB3,676.0
- Samsung 970 Evo Plus 500 GB3,578.4
- Samsung 980 1TB3569.3
- Crucial P5 1TB3518.5
- Crucial P5 2 TB3.517,8
- WD Black SN750 1 TB3.487, 6
- Intel 670p 1TB3318.9
- Corsair MP510 1TB3101.1
- WD Blue SN550 2TB2585.1
- Kingston A2000 1 TB2,281.9
- Kingston A1000 480 GB1,638.6
- SanDisk Extreme Pro Portable 1TB V11.027.1
- SanDisk Extreme Portable 1 TB V21027.0
- Samsung Portable T7 Shield 2 TB1023.5
- Crucial X6 Portable 4 TB825,4
- Patriot Supersonic Prime615,0
- Crucial X6 Portable 2 TB568,4
- Samsung 870 Evo 2 TB550,6
- Crucial MX500 1 TB M3CR033550,1
- Crucial MX500 1TB M3CR010550.1
- Samsung 870 QVO 1 TB549,4
- Samsung 870 Evo 1 TB549,3
- Patriot P210 2TB (2nd Sample)538.6
- Patriot P2xx 2TB (1st Sample)536.6
- Crucial MX500 4 TB531,3
- SanDisk Ultra Plus 256GB453.1
- Seagate Exos X18 TB280,8
- Synology HAT5300-8T246,9
- Seagate IronWolf 4TB (ST400VN008)193,9
- WD Red 6 TB (WD60EFRX)174.9
- Seagate FireCuda Gaming HDD 5 TB147,4
li>
li>
- Seagate FireCuda 530 2 TB4371.6
- WD Black SN850 1 TB4351.6
- Corsair MP600 Pro XT 2 TB4348.5
- PNY XLR8 CS3140 1 TB4341.9
- Crucial P5 Plus 1 TB4314.0
- Asus ROG Strix SQ7 1 TB4287.7
- Corsair MP600 Pro LPX 2 TB4248.4
- Samsung 980 Pro 1 TB4. 245.7
- Samsung 980 Pro 500 GB4,176.2
- Samsung 980 Pro 2 TB4.168.5
- Kioxia Exceria Pro 2 TB4.136.9
- Corsair MP600 Pro 2 TB3878.7
- Mushkin Gamma 2 TB3857.7
- Adata XPG Gammix S70 1 TB3779.8
- Adata XPG Gammix S70 Blade 1 TB3745.6
- Adata XPX Legend 840 1TB3562.8
- HP FX900 Pro 2TB3402.2
- Patriot Viper VP4300 2TB 1.2A3241.4
- Patriot Viper VP4300 2TB3202.7
- Crucial P3 Plus 1TB3,075.1
- Corsair MP600 2TB3. 074.1
- Samsung 970 Evo Plus 500 GB2,996.5
- Intel 670p 1 TB2926.6
- Corsair MP600 Core 2 TB2761.3
- < strong>Crucial P3 1 TB2,725.5
- WD Black SN750 1 TB2,614.5
- Crucial P5 1 TB2 .480.5
- Crucial P5 2 TB2.478.9
- Samsung 980 1TB2349.7
- Mushkin Delta 1 TB2303.5
- Corsair MP510 1 TB2142.5
- WD Blue SN550 2 TB2099.5< /li>
- Kingston A2000 1 TB1,988.1
- Kingston A1000 480 GB1,152, 7
- SanDisk Extreme Pro Portable 1 TB V1851,3
- SanDisk Extreme Portable 1 TB V2746,4
- Samsung Portable T7 Shield 2 TB710,6
- Crucial X6 Portable 2 TB542,3
- Crucial MX500 1TB M3CR010538 ,3
- Samsung 870 Evo 2 TB537,8
- Samsung 870 Evo 1 TB537 ,7
- Crucial MX500 1TB M3CR033536,9
- Samsung 870 QVO 1TB535,6
- Crucial X6 Portable 4 TB524.8
- Patriot P2xx 2 TB (1st pattern)523.4
- Patriot P210 2TB (2nd pattern)520.8
- SanDisk Ultra Plus 256 GB515.9
- Crucial MX500 4 TB460,0
- Patriot Supersonic Prime405,5
- Seagate Exos X18 TB278,9
- Synology HAT5300- 8T248.6
- Seagate IronWolf 4TB (ST400VN008)192.0
- WD Red 6 TB (WD60EFRX)177,2
- Seagate FireCuda Gaming HDD 5 TB146,2
li>
- < li class="chart__row">WD Black SN850 1 TB3,959.1
- Adata XPX Legend 840 1 TB89,1< /li>
- HP FX900 Pro 2 TB87.1
- Samsung 980 Pro 500 GB87.0
- Adata XPG Gammix S70 1 TB86,8
- Samsung 980 Pro 1 TB86,4
- Adata XPG Gammix S70 Blade 1 TB86,0
- Samsung 980 Pro 2 TB83,5
- Corsair MP600 Pro LPX 2 TB83.1
- Seagate FireCuda 530 2 TB82,4
- PNY XLR8 CS3140 1 TB82,3
- Corsair MP600 Pro XT 2 TB82,2
- WD Black SN850 1 TB82,2
- Asus ROG Strix SQ7 1 TB78.6
- Intel 670p 1 TB76.4
- Patriot Viper VP4300 2 TB73,2
- Mushkin Gamma 2 TB72,2
- Corsair MP600 Pro 2 TB72, 1
- Kioxia Exceria Pro 2 TB69.7
- Crucial P5 Plus 1 TB68.3
- Mushkin Delta 1 TB67.0
- Corsair MP600 Core 2 TB66,1
- Samsung 980 1 TB64,7
- Kingston A2000 1 TB63,4
- Corsair MP600 1 TB62,1
- Crucial P3 Plus 1TB61.8
- Crucial P3 1TB59.9
- Corsair MP600 2 TB59,1
- Crucial P5 1 TB58,2
- Crucial P5 2 TB57,4
- WD Blue SN550 2 TB56,4
- Corsair MP510 1 TB53,9
- Samsung 970 Evo Plus 500 GB53.1
- WD Black SN750 1 TB52.7
- Samsung 870 Evo 2 TB46.5
- Samsung 870 Evo 1 TB46,2
- Patriot P2xx 2 TB (1st sample)41, 2
- SanDisk Extreme Portable 1 TB V240,1
- Kingston A1000 480 GB39.9
- Samsung 870 QVO 1 TB39.3
- Crucial MX500 4 TB39,1
- Crucial MX500 1TB M3CR03338.0
- SanDisk Extreme Pro Portable 1TB V137.7
- Patriot Supersonic Prime36,9
- Crucial MX500 1TB M3CR01034,9
- Crucial X6 Portable 4 TB33,7
- Patriot P210 2TB (2nd sample)33.6
- SanDisk Ultra Plus 256 GB32.7
- Crucial X6 Portable 2 TB31,4
- Samsung Portable T7 Shield 2 TB30,0
- Seagate Exos X18 TB0,8
- Synology HAT5300-8T0,7
- Seagate IronWolf 4TB (ST400VN008)0.6
- WD Red 6TB (WD60EFRX)0.6
- Seagate FireCuda Gaming HDD 5 TB0.5
li>
Unit: Megabytes per second (MB/s) 124 entries CrystalDiskMark 7.0.0 (Write)
- Sequential (1MiB/Q8T1):
- Corsair MP600 Pro LPX 2 TB6,885.0
- Seagate FireCuda 530 2 TB6869.6
- Corsair MP600 Pro XT 2 TB6865.7
- Patriot Viper VP4300 2 TB6,777.1
- Corsair MP600 Pro 2 TB6.771.8
- Patriot Viper VP4300 2TB 1.2A6768.2
- Mushkin Gamma 2 TB6763.3
- HP FX900 Pro 2 TB6,681.0
- Adata XPG Gammix S70 1 TB6,445.1
- Adata XPG Gammix S70 Blade 1 TB6.331.3
- Kioxia Exceria Pro 2 TB6022.9
- Asus ROG Strix SQ7 1 TB5893.1
- PNY XLR8 CS3140 1 TB5,844.1
- WD Black SN850 1 TB5,206.7
- Samsung 980 Pro 1 TB5019.6
- Crucial P5 Plus 1 TB5015.3
- Samsung 980 Pro 2 TB5009.0
- Samsung 980 Pro 500 GB4916.8
- Adata XPX Legend 840 1 TB4843, 3
- Corsair MP600 1 TB4.286.7
- Corsair MP600 2 TB4266.3
- Corsair MP600 Core 2 TB3641.3
- Crucial P3 Plus 1TB3,613.1
- Crucial P5 1TB3,300.0
- Samsung 970 Evo Plus 500 GB3,292.8
- Crucial P5 2TB3237.6
- Crucial P3 1TB3224.9
- Corsair MP510 1 TB3038.4
- WD Black SN750 1 TB3017.1
- Samsung 980 1TB2823.4
- Intel 670p 1TB2581.0
- Kingston A2000 1TB2180.5
- Mushkin Delta 1TB1923.5
- WD Blue SN550 2 TB1,848.6
- Kingston A1000 480 GB1,010, 8
- SanDisk Extreme Pro Portable 1 TB V1969.9
- SanDisk Extreme Portable 1 TB V2956,7
- Samsung Portable T7 Shield 2 TB915,8
- Crucial X6 Portable 4 TB811,7
- Patriot Supersonic Prime538,6
- Crucial X6 Portable 2 TB522,2
- Samsung 870 Evo 2 TB487,4
- Samsung 870 Evo 1 TB486,9
- Samsung 870 QVO 1 TB486,4
- Patriot P210 2TB (2nd Sample)485.3
- Crucial MX500 1TB M3CR033476.2
- Crucial MX500 4 TB471.3
- Patriot P2xx 2 TB (1st pattern)468.5
- Crucial MX500 1TB M3CR010467,3
- SanDisk Ultra Plus 256 GB432.3
- Seagate Exos X18 TB274.7
- Synology HAT5300-8T244,0
- Seagate IronWolf 4TB (ST400VN008)188 ,3
- WD Red 6 TB (WD60EFRX)170.2
- Seagate FireCuda Gaming HDD 5 TB139,8
li>
- Sequential (1MiB/Q1T1):
- < li class="chart__row chart__row--hidden toggle-body-item nojs-tr">Corsair MP600 Pro 2 TB5,923.0
- Mushkin Gamma 2 TB5,879.7
- Seagate FireCuda 530 2 TB5855.3
- Corsair MP600 Pro XT 2 TB5822.5
- Corsair MP600 Pro LPX 2 TB5,821.6
- Patriot Viper VP4300 2 TB5,759.9
- Patriot Viper VP4300 2TB 1.2A5.741.1
- PNY XLR8 CS3140 1 TB5605.1
- HP FX900 Pro 2 TB5588.9
- Kioxia Exceria Pro 2 TB5576, 1
- Asus ROG Strix SQ7 1 TB5498.4
- Adata XPG Gammix S70 1 TB5473.6
- WD Black SN850 1 TB5,199, 6
- Adata XPX Legend 840 1TB4,845.0
- Crucial P5 Plus 1 TB4,787.4
- Samsung 980 Pro 2 TB4,279.4
- Samsung 980 Pro 1 TB4278.3
- Corsair MP600 1 TB4274.2
- Samsung 980 Pro 500GB4189.1
- Corsair MP600 Core 2 TB3,627.5
- Crucial P3 Plus 1 TB3,587.7
- Samsung 970 Evo Plus 500 GB3155.6
- Crucial P5 1 TB3008.0
- Crucial P5 2 TB2,990.3
- WD Black SN750 1 TB2,954.7
- Crucial P3 1TB2,925.2
- Corsair MP510 1 TB2,846.4
- Samsung 980 1 TB2,633.4
- Intel 670p 1TB2459.5
- Kingston A2000 1TB2044.5
- Mushkin Delta 1 TB1,932.7
- WD Blue SN550 2 TB1,842.6
- Kingston A1000 480GB1008.5
- SanDisk Extreme Pro Portable 1 TB V1889.3
- SanDisk Extreme Portable 1 TB V2873,3
- Samsung Portable T7 Shield 2 TB808,1
- Crucial X6 Portable 4 TB769,3
- Samsung 870 Evo 1 TB477,4
- Samsung 870 Evo 2 TB477,3
- Patriot P210 2 TB (2nd sample)476.9
- Samsung 870 QVO 1 TB475.8
- Crucial MX500 1TB M3CR010462.7
- Patriot P2xx 2TB (1st sample)461.0< /li>
- Crucial MX500 1TB M3CR033459,1
- Crucial MX500 4 TB452,4
- SanDisk Ultra Plus 256 GB426.3
- Patriot Supersonic Prime296.5
- Seagate Exos X18 TB276,9
- Synology HAT5300-8T246,7
- Seagate IronWolf 4TB (ST400VN008)191.2
- WD Red 6TB (WD60EFRX)170.5
- Seagate FireCuda Gaming HDD 5 TB145,7
- Crucial X6 Portable 2 TB127,7
li>
< li class="chart__row chart__row--hidden toggle-body-item nojs-tr">Adata XPG Gammix S70 Blade 1 TB5,372.0
< li class="chart__row chart__row--hidden toggle-body-item nojs-tr">Corsair MP600 2 TB4.255,8
li>
- Patriot Viper VP4300 2TB3492.3
- Patriot Viper VP4300 2TB 1.2A3482.1
- Mushkin Gamma 2 TB3.291.8
- Corsair MP600 Pro 2 TB3290.5
- Seagate FireCuda 530 2 TB3209.7
- Adata XPG Gammix S70 1 TB3194 ,1
- Corsair MP600 2 TB3091.9
- Corsair MP600 Core 2 TB3090.8< /li>
- Samsung 980 Pro 500 GB3060.7
- Samsung 980 Pro 2 TB3055.5
- Corsair MP600 Pro XT 2 TB3055.3< /li>
- Corsair MP600 1TB3032.3
- Samsung 980 Pro 1TB3029.6
- WD Black SN850 1TB2891.7
- Corsair MP600 Pro LPX 2 TB2833.4
- Adata XPX Legend 840 1 TB2813.6
- PNY XLR8 CS3140 1 TB2,796.2
- Kioxia Exceria Pro 2 TB2,773.9
- HP FX900 Pro 2 TB2772.3
- Crucial P5 Plus 1 TB2687.8
- Samsung 970 Evo Plus 500 GB2668.8
- Crucial P3 1 TB2,589.9
- Adata XPG Gammix S70 Blade 1 TB2 .530.2
- Corsair MP510 1 TB2,522.7
- Crucial P3 Plus 1 TB2,328, 0
- WD Black SN750 1TB2,289.9
- Asus ROG Strix SQ7 1 TB2,286.5
- Crucial P5 2 TB2,000.5
- Mushkin Delta 1 TB1,971.5
- Crucial P5 1 TB1,898.5
- Samsung 980 1 TB1,893.5
- WD Blue SN550 2 TB1,562.1
- Intel 670p 1TB1259.7
- Kingston A2000 1 TB1,122.5
- Kingston A1000 480 GB782.7
- SanDisk Extreme Pro Portable 1TB V1364.8
- SanDisk Extreme Portable 1TB V2354.0
- Samsung Portable T7 Shield 2 TB298.5
- Crucial X6 Portable 4 TB285.0
- Patriot Supersonic Prime267.1
- Crucial MX500 1TB M3CR033196,8
- Samsung 870 Evo 1 TB195,6
- Samsung 870 Evo 2 TB195,2
- Samsung 870 QVO 1 TB195,2
- Crucial MX500 4 TB195,2
- Crucial MX500 1TB M3CR010194,6
- Crucial X6 Portable 2 TB190,3
- SanDisk Ultra Plus 256 GB176,6
- Patriot P2xx 2TB (1st pattern)176.1
- Patriot P210 2TB (2nd sample)99.6
- Seagate Exos X18 TB19,3
- Seagate FireCuda Gaming HDD 5 TB6,6
- WD Red 6 TB (WD60EFRX)2,5
- Synology HAT5300-8T1,9
- Seagate IronWolf 4TB (ST400VN008)1.6
li>
- Corsair MP600 Pro 2 TB264 ,6
- Mushkin Gamma 2 TB263,0
- Corsair MP600 Pro LPX 2 TB260 ,5
- PNY XLR8 CS3140 1 TB260,2
- Seagate FireCuda 530 2 TB260 ,2
- Corsair MP600 Pro XT 2 TB255.9
- Kioxia Exceria Pro 2 TB250.3
- Corsair MP600 1 TB248,4
- WD Black SN850 1 TB245,0
- Mushkin Delta 1 TB238.9
- Corsair MP600 Core 2 TB236.0
- Patriot Viper VP4300 2TB 1.2A236.0
- Patriot Viper VP4300 2TB235.2
- Corsair MP600 2 TB232,3
- Adata XPX Legend 840 1 TB228,0
- HP FX900 Pro 2 TB227.5
- Adata XPG Gammix S70 1 TB223.4
- Crucial P3 Plus 1 TB< /strong>220.6
- Adata XPG Gammix S70 Blade 1 TB218,4
- Asus ROG Strix SQ7 1 TB217,5< /li>
- WD Blue SN550 2 TB217,0
- WD Black SN750 1 TB214,2
- < strong>Crucial P3 1TB213.5
- Samsung 980 Pro 1TB208.1
- Corsair MP510 1TB207.0
- Kingston A2000 1TB206.2
- Samsung 980 Pro 2 TB204,3
- Samsung 980 Pro 500 GB203.2
- Samsung 970 Evo Plus 500 GB202.9
- Intel 670p 1 TB193.2
- Crucial P5 Plus 1 TB191.5
- Samsung 980 1TB177.7
- Kingston A1000 480 GB134.3
- Crucial P5 1 TB130.8
- Crucial P5 2 TB128,6
- Samsung 870 Evo 2 TB97,6
- Samsung 870 Evo 1 TB96,3
- Samsung 870 QVO 1 TB96,1
- Patriot P2xx 2TB (1st sample)96.0
- Crucial MX500 1TB M3CR01095,3
- Patriot P210 2TB (2nd Sample)95.0
- Crucial MX500 1TB M3CR03389,2
- Crucial MX500 4 TB87,7
- Patriot Supersonic Prime82,0
- Crucial X6 Portable 4 TB81,5
- SanDisk Ultra Plus 256 GB79,8
- SanDisk Extreme Pro Portable 1TB V175.8
- SanDisk Extreme Portable 1TB V269,9
- Crucial X6 Portable 2 TB56,4
- Samsung Portable T7 Shield 2 TB41,5
- Seagate Exos X18 TB17,4
- Seagate FireCuda Gaming HDD 5 TB5,0
- WD Red 6 TB (WD60EFRX)2.5
- Synology HAT5300 -8T1,9
- Seagate IronWolf 4TB (ST400VN008)1.6
Unit: Megabytes per Second (MB/s)
Conclusion
It is often not so easy for the editors to make a judgment about an SSD, since the performance is usually similar. The measurements for the Crucial P3 and P3 Plus make it easy, albeit in a less than pleasant way. With considerable weaknesses both in practical reading and in writing in SLC mode, the series with the same construction are a failure.
What part of the misery is the tiny single-core controller without DRAM, Micron's new QLC-NAND and the firmware each have, but cannot yet be fathomed. This combination is still completely new on the market.

Only if the price were right would the two Crucial SSDs still be considered as archive storage (“data grab”), although the read and copy performance are strong counter-arguments in this case as well. Either way, there are far faster alternatives for the same price of currently 90 euros for the P3 and 110 euros for the P3 Plus, each with 1 TB in September 2022.
Crucial even has one to hand: The P5 Plus (test) with 1 TB for 98 euros is miles better and, like the similarly priced Samsung 980 Pro (test), is currently no longer just a buying tip for enthusiasts.
< p class="p text-width">However, there is one positive aspect to be gained from the new Crucial SSDs. The option of 4 TB storage space, which is still rarely found with M.2 SSDs, is available from Crucial at a comparatively low price. Retailers list the P3 with 4 TB from around 400 euros and the P3 Plus with 4 TB from around 470 euros, but they cannot deliver at the moment. Only Adata can currently keep up with the older Spectrix S40G and SX8100 models in terms of price.
Other manufacturers only offer 4 TB as an M.2 PCIe SSD for ( significantly) over 500 euros, but then mostly with better TLC memory, which makes Crucial's QLC SSDs look old.
- All SSD tests on ComputerBase
- SSD buying guide and ranking
- News and reports on the “SSD” topic page
ComputerBase was loaned the P3 SSD and P3 Plus SSD from Crucial for testing . The manufacturer did not influence the test report and there was no obligation to publish it. There was no NDA.
(*) Links marked with an asterisk are affiliate links. In the case of an order via such a link, ComputerBase participates in the sales revenue without increasing the price for the customer.
This article was interesting, helpful or both? The editors are happy about any support from ComputerBase Pro and disabled ad blockers. More about ads on ComputerBase.