

Milestone for Intel: After years of delay, Intel is now producing more 10 nm chips than 14 nm solutions. These statements mark a second quarter that was above expectations and in which the server division in particular was under pressure. In the consumer business, own factories help once again.
This is accompanied by significant cost reductions in this area, which once again show how much Intel was still at the beginning of 10 nm production even last year, when Ice Lake had already been on the market for a year and Tiger Lake was launched . The manufacturer says today that it has reduced the costs per wafer by 45 percent within one year. Tiger Lake has delivered more than 50 million solutions to date, Ice Lake-SP has been with us since the beginning of the year, Alder Lake is now following and should also reach millions of units this year.
Extremely high demand for many quarters
Once again, Intel is playing off its own production. In the consumer segment, 33 percent more processors were shipped, which could even more than make up for a lower average price, especially in the notebook. The division now makes over 10 billion US dollars in sales again, marking a record for a second quarter, with operating profit rising from 2.8 to 3.8 billion US dollars.
-
 Revenue from Intel Client division in Q2/2021 (Image: Intel)
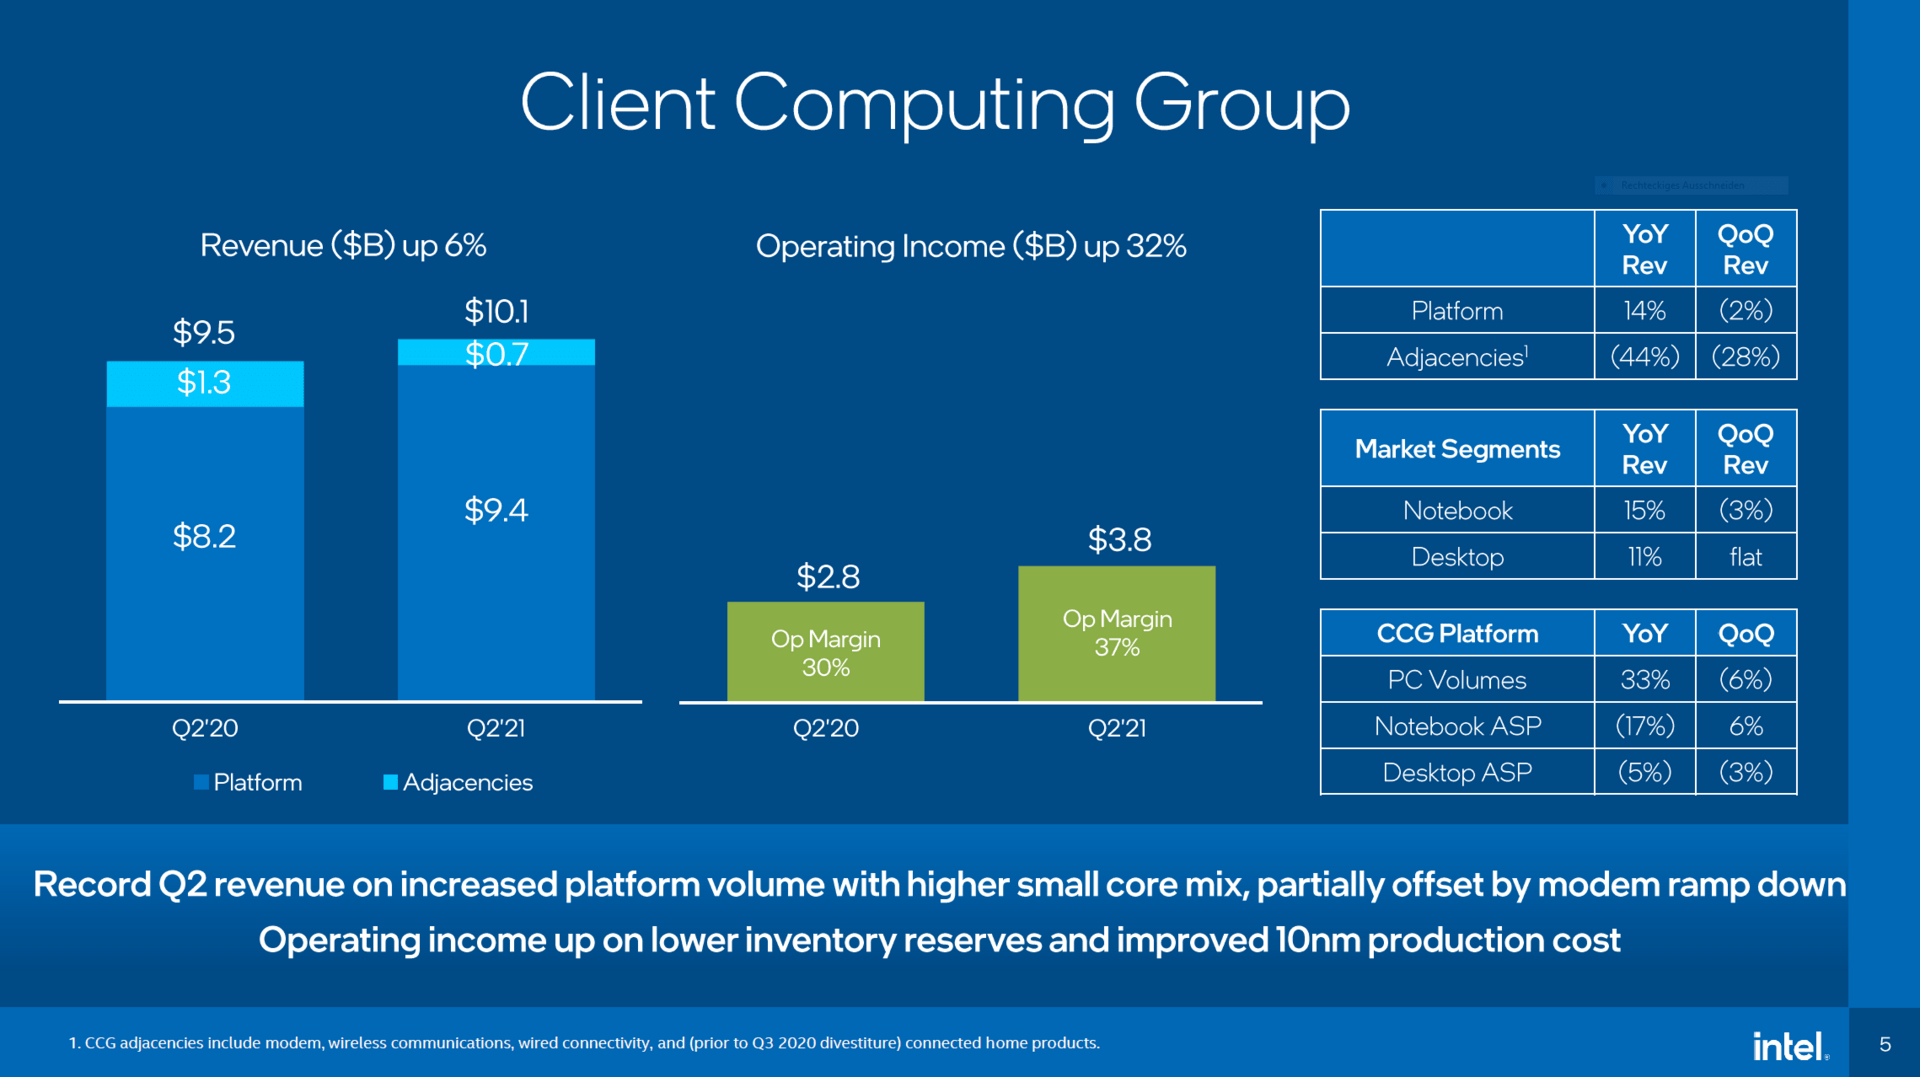 Revenue from Intel client division in Q2/2021
 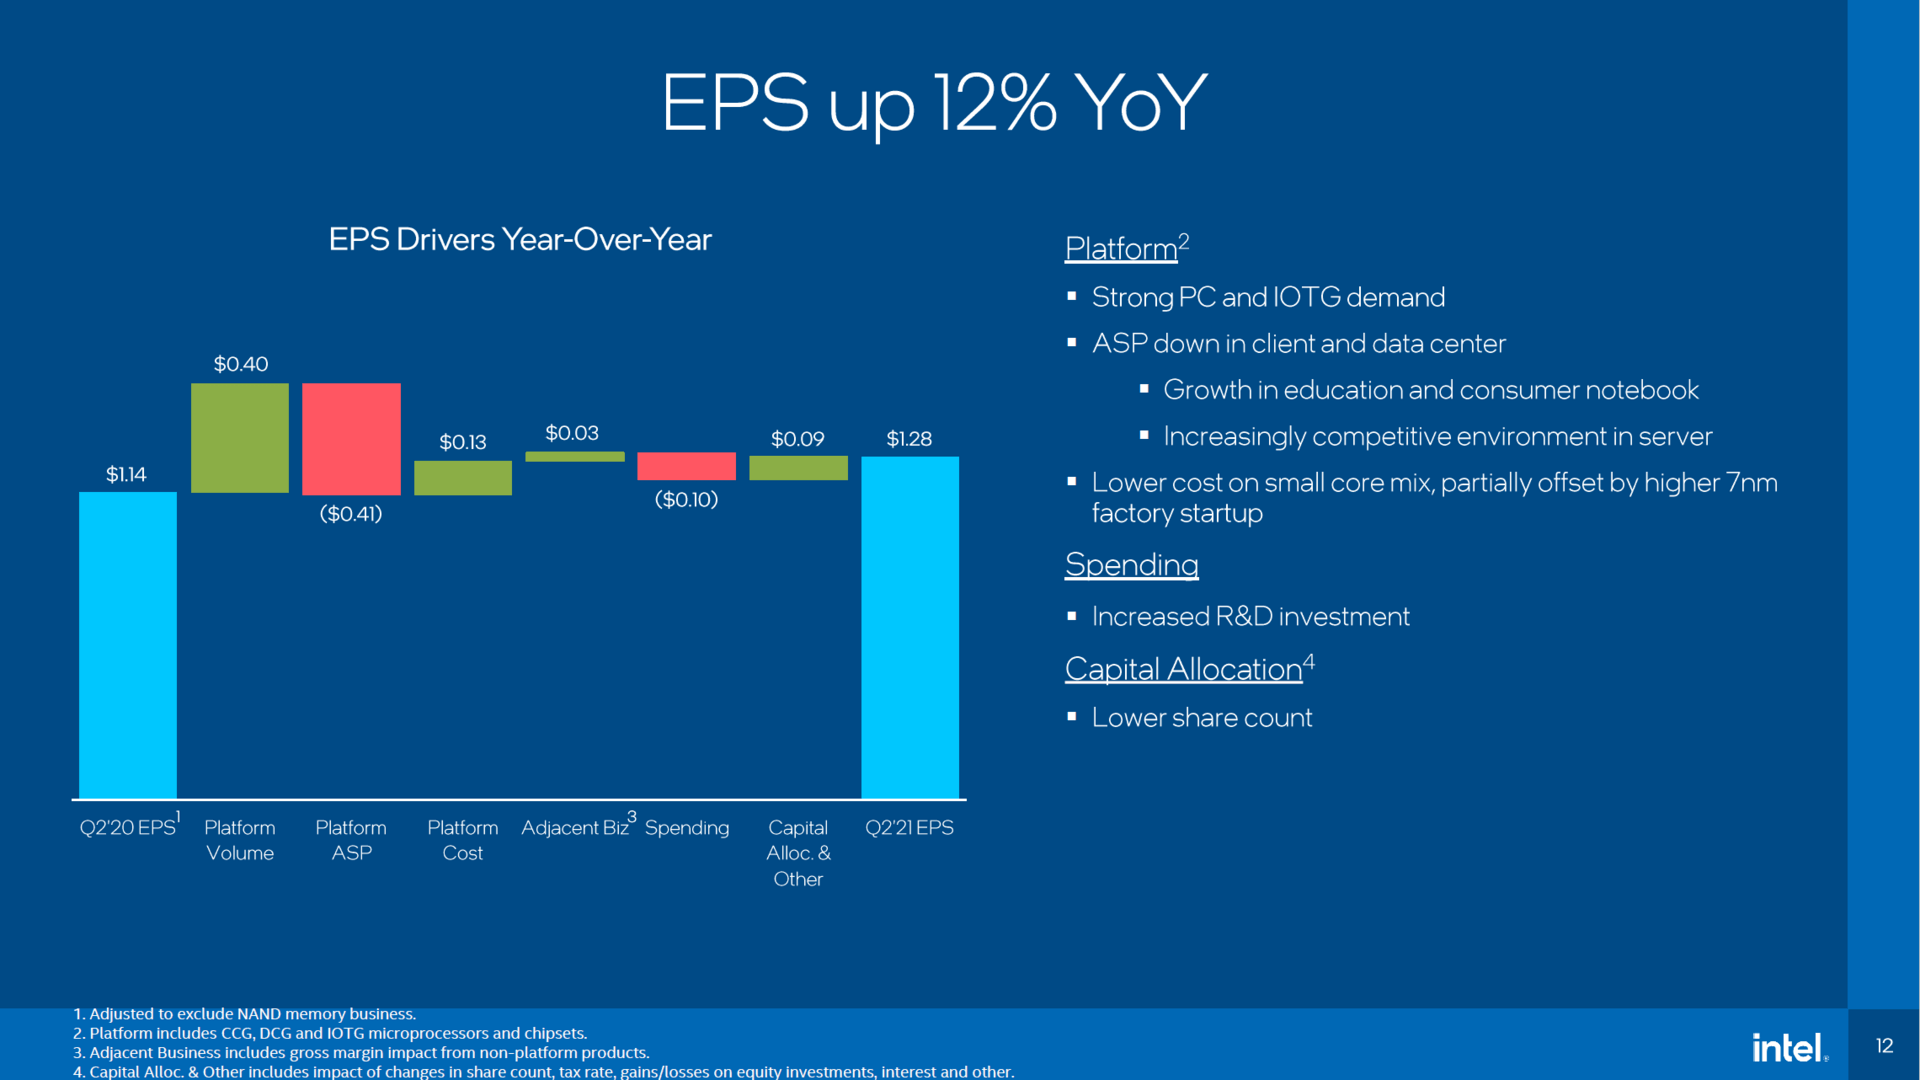 Development and influences on profit
 However, Intel also recognized that chip production alone is not enough and invested in substrate production a few months ago. These are now available and should provide millions of substrates for the second half of the year, an advantage that other manufacturers do not have.
But even Intel explains that it cannot meet all customer requirements, the demand is still so high. Especially in the third quarter it could hit the client division, the whole problems of the industry should continue for many quarters, explains Intel's CFO
We remain in a highly constrained environment where we are unable to fully supply customer demand. In CCG, we continue to see very strong demand for our client products and expect TAM growth to continue. However, persistent industry-wide components in substrate shortages are expected to lower CCG revenues sequentially. We expect supply shortages to continue for several quarters, but appear to be particularly acute for clients in Q3.
Intel CFO George Davis
Server stumble, Mobileye wins
The server division shows that not everything is running smoothly at Intel. This is where AMD is beating the market leader the most, of course the eternal delays also play a role here. This is especially visible in profit, which fell by a billion US dollars, while sales were still relatively good at a minus of eight percent. Ultimately, however, that is still complaining at a very high level, sales in this area are still the fourth best of all time. Ice Lake-SP should increase significantly in terms of quantities in the second quarter, but Sapphire Rapids with a significantly better complete package will not intervene until next year.
In the other divisions, the automotive sector in particular was able to shine under Mobileye. 124 percent more sales and 10 new design wins for a total of 16 million vehicles, including from Toyota, allow Intel to have a say in the ADAS and autonomous driving business.
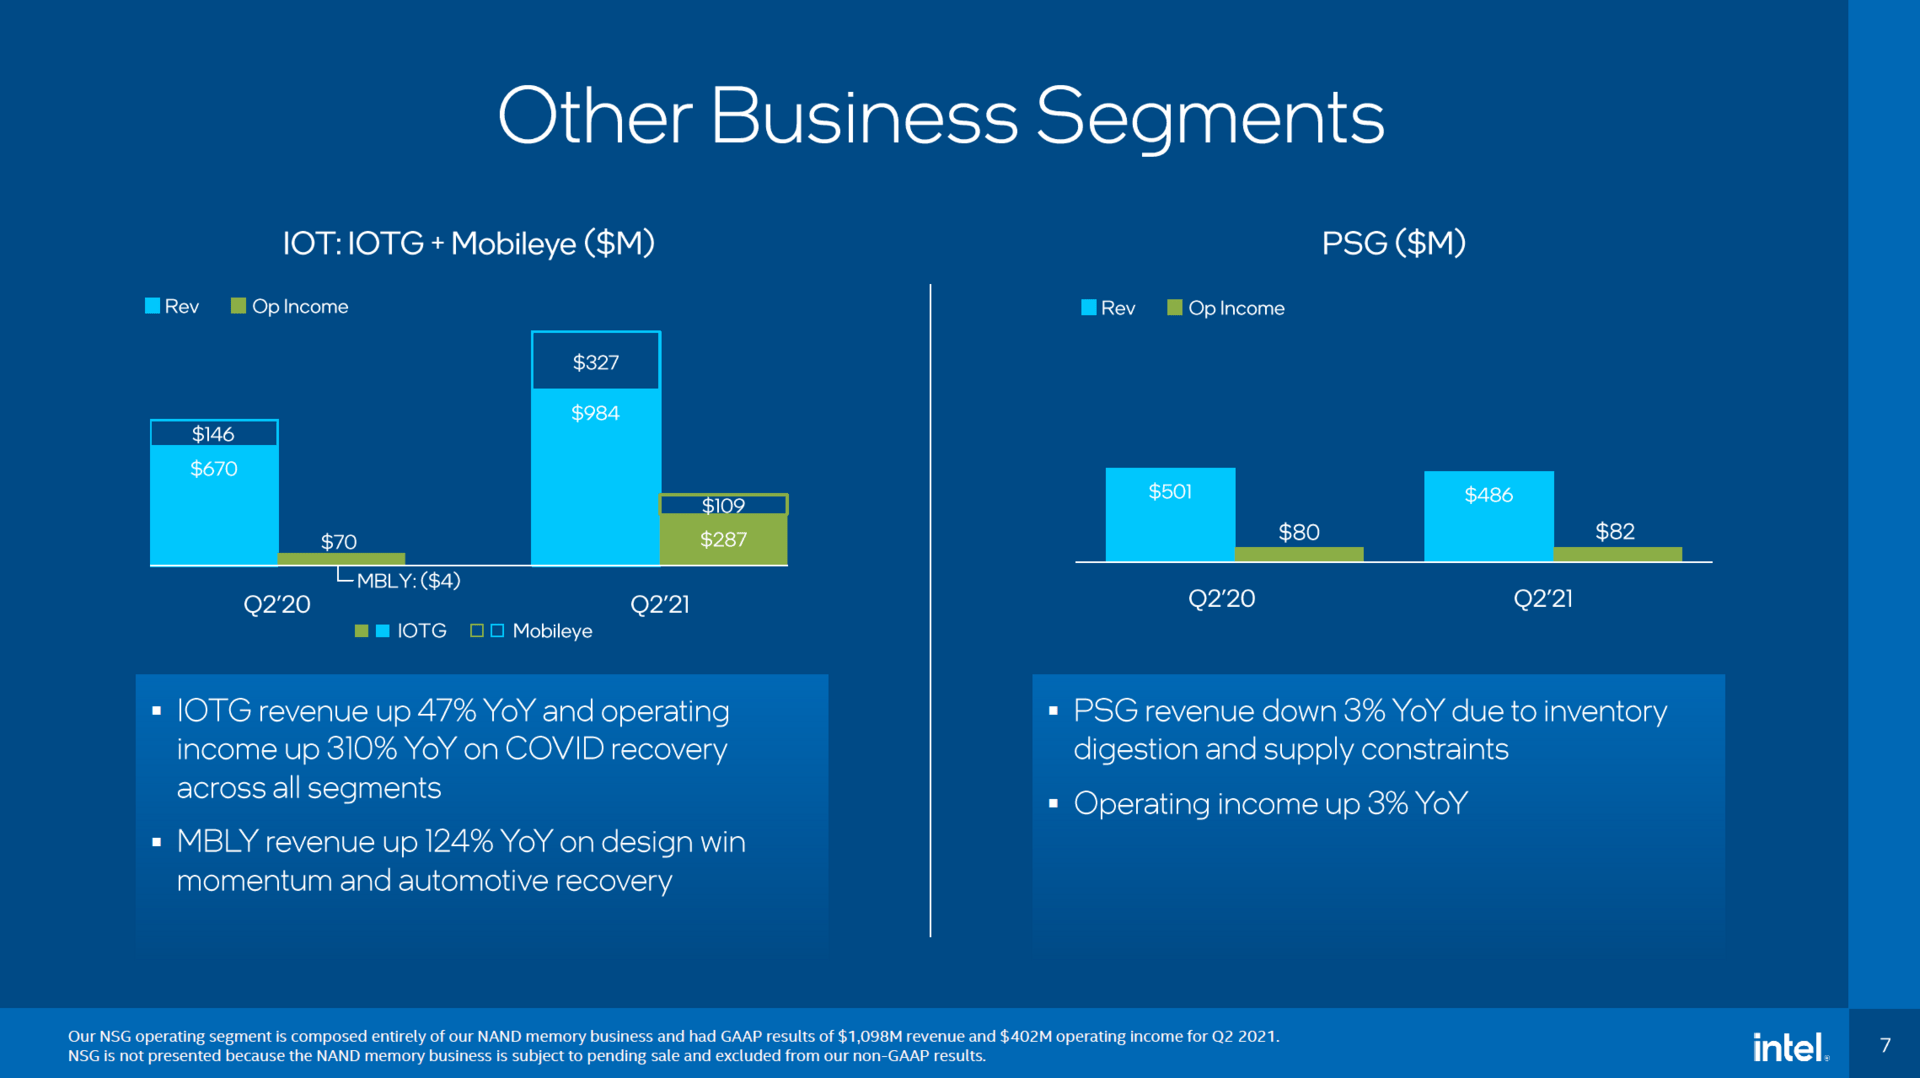 Sales of Intel's other divisions in Q2/2021 (Image: Intel)
 The bottom line was that sales in the end were 18.5 billion US dollars (non-GAAP), respectively $ 19.6 billion (GAAP), net income over $ 5 billion, which on balance was on a similar level to last year. Intel expects the same in the third quarter, the planned modifications of the new CEO need a lot of time. The new foundry model is leading the way, CEO Pat Gelsinger explained here that 100 potential customers have already turned to her. Intel will reveal more about this next Monday in a separate event.
Intel: Sales and profits since Q1/2003 -1.0003.4007.80012.20016.60021.000 Q1/2003Q3/2003Q1/2004Q3/2004Q1/2005Q3/2005Q1/2006Q3/2006Q1/2007Q3/2007Q1/2008Q3/2008Q1/2009Q3/2009Q1/2010Q3/2010Q1/2011Q3/2011Q1/2012Q3/2012Q1/2013Q3/2013Q1/2014Q3/2014Q1/2015Q3/2015Q1/2016Q3/2016Q1/2017Q3/2017Q1/2018Q3/2018Q3/2018Q1/2018Q3/2018Q1 2019Q3/2019Q1/2020Q3/2020Q1/2021 US GAAP sales US GAAP net income