
If you have Google Analytics installed on your website, then you’ve likely come across the terms “metric” and “dimension” while reviewing your website traffic and other performance data.
If you’re curious what these terms mean, this guide will help you understand these metrics, how to search for them, and what they can tell you about your traffic.


What Is a Dimension in Google Analytics?
Google Analytics provides you with some valuable insight into your website traffic. You can use Google Analytics on your own site, or on free blog services like Squarespace or Wix. It’s also easy to integrate Google Analytics into your WordPress site.
This means you can use your newfound understanding of dimensions and metrics to analyze any site you have online.
To understand how dimensions and metrics work in Google Analytics, consider the following simple definitions.
- A dimension is what you want to measure.
- A metric is how you want to measure the dimension.
For example, you might be interested in how many sessions are coming from sites that refer traffic to you. In this case your dimension would be Referral Path, and the metric would be Sessions.

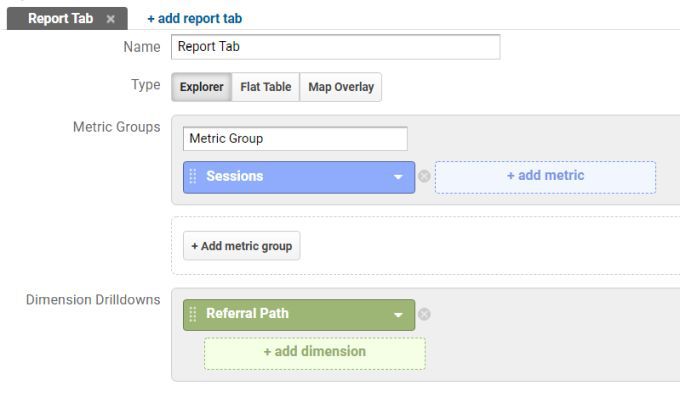
In Google Analytics, you can either use premade reports with existing dimensions and common metrics, or create custom reports (like the one above).
You’ll always need to decide which dimension you want to measure first, before you can choose associated metrics.
What Is a Metric in Google Analytics?
The metric you can choose depends on which dimension you want to examine.
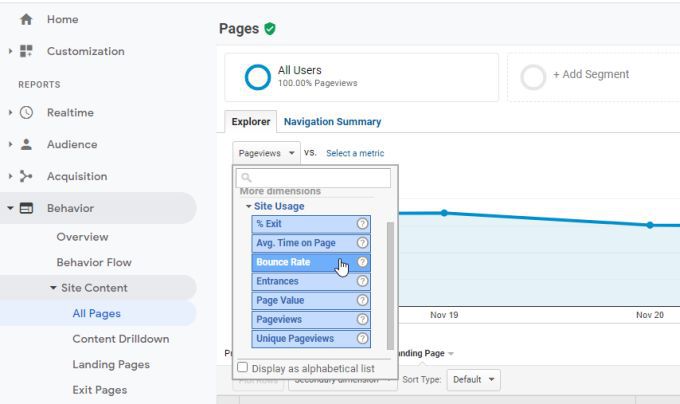
One of the most common things website owners want to measure is the overall traffic on all pages on their site. This is a premade page that you can check any time.
To view this, select Behavior in the left navigation menu in Google Analytics. Next select Site Content, and then All Pages.

This premade report provides the Pageviews metric for the All Pages dimension.
If you want to see Pageviews for some other dimension, you can select the dropdown arrow near Other next to Primary Dimension at the top of the pages list.

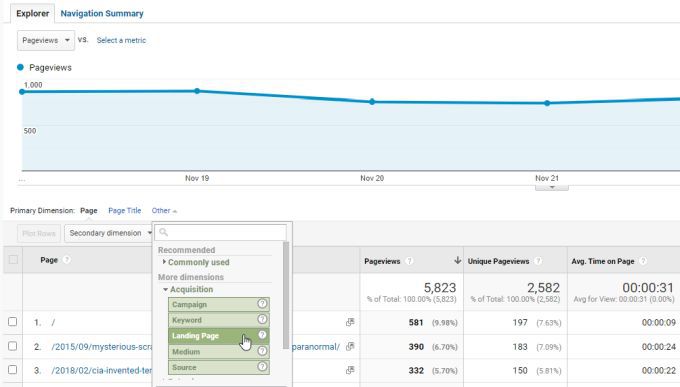
As you can see, you could switch the dimension from All Pages to something like Landing Page. This will show you Pageviews only for your website’s pages that are the initial page visitors land on when they come to your site.
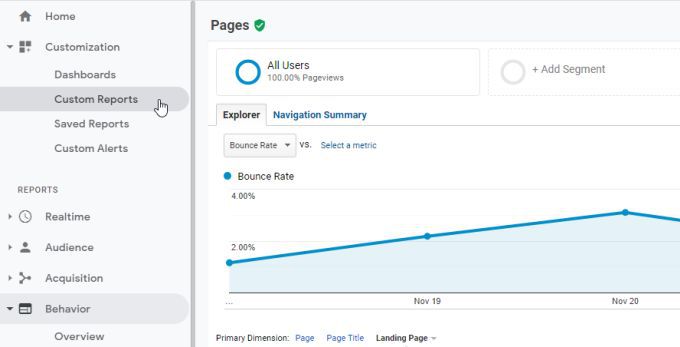
On any of these premade reports, you can also change the metric for the view. For example, if you’re more interested at what rate visitors leave the same page they arrive on, you can change the metric to bounce rate.
To do this, select the Pageviews metric underneath the Explorer tab, and select Bounce Rate from the list of metrics.

This will change the chart graphic to show the Bounce Rate metric for the Landing Page dimension rather than the Pageviews dimension.
Creating Custom Reports in Google Analytics
If you find that there aren’t any premade reports in Google Analytics that show what you’re looking for, you can create custom reports instead. With custom reports, you can define the dimensions and metrics that show you what you need.
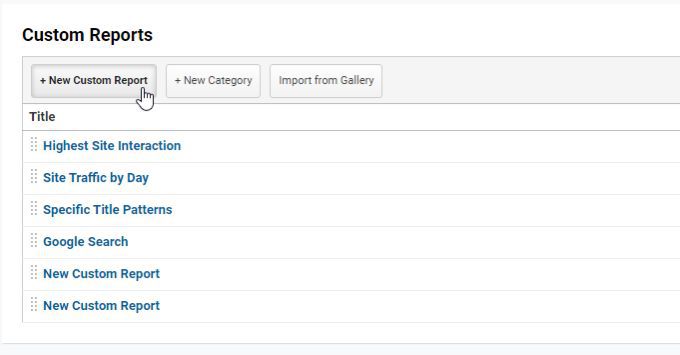
To create a custom report, select Customization from the left menu. Then select Custom Reports.


This will take you to a report builder page where you can select the metrics and dimensions you want to graph.
To start designing a new custom report, select the New Custom Report button.

In the custom report design window, you’ll see two main boxes: Metric Groups and Dimension Drilldowns.

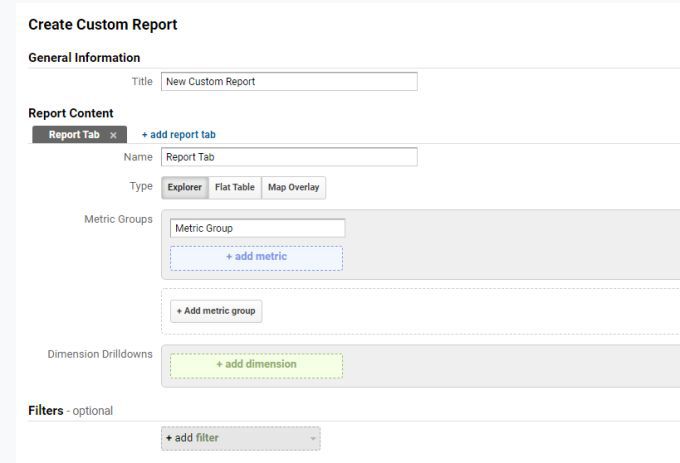
If you’re not sure exactly what you want to see, you can select + add dimension to see what dimensions are available.
In this example, we’ll create a custom report to show how much traffic comes from different social networks.

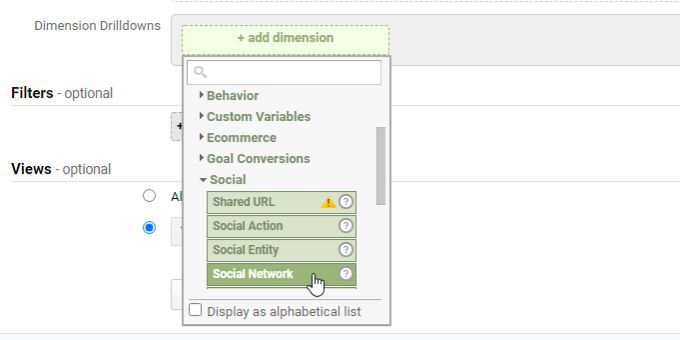
Scroll down the list of dimensions and use the dropdown sections to see which specific dimensions are available.
To see traffic coming from different social networks, you’d just select Social from the list of dimensions, and then Social Network for the specific dimension to see.
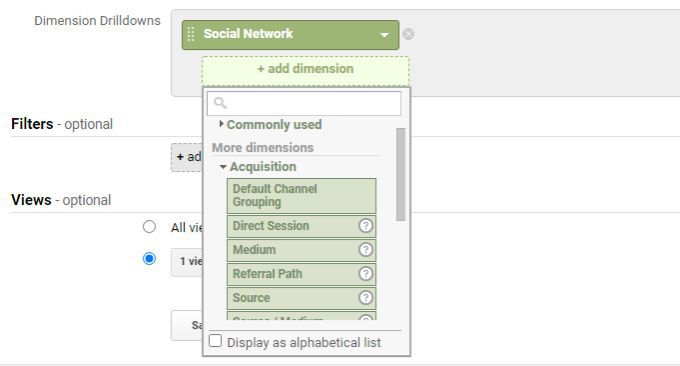
For more advanced reports, you could add a second dimension by selecting + add dimension. This will display graphs comparing multiple dimensions using the same metrics.

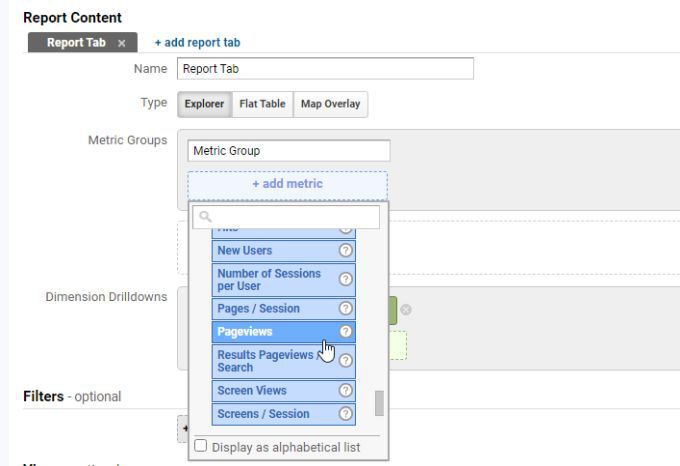
Speaking of metrics, next you should add which metrics you want to measure by selecting + add metric in the Metric Groups section.
In this example, we want to see how many pageviews come from social networks. To do this, you’d select Users in the metrics dropdown, and then Pageviews from the dropdown list of metrics.

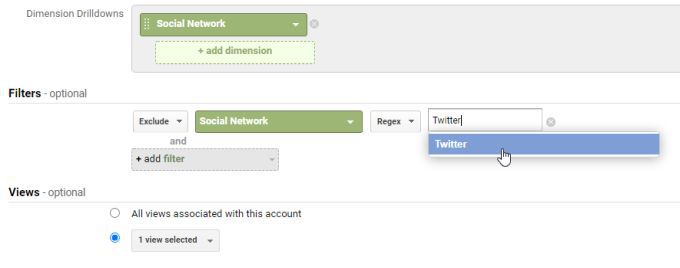
You’ll notice a Filter field at the bottom of the custom report window. You can use a filter to either include or exclude specific things you may not care about. For example, in this case we don’t want to include Twitter traffic in the report.
To do this, you’d change the setting under Filters to Exclude, select the Social Network dimension, and then type Twitter into the specific filter field.

When you’re done setting everything up in the report builder window, just select Save to finish.
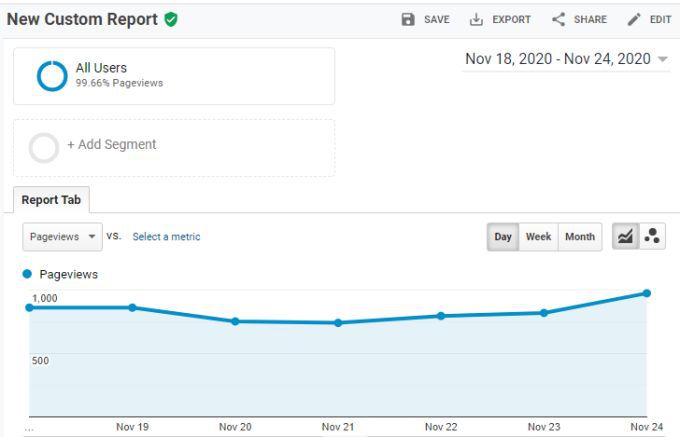
Now you’ll see the report window. The top part of the report will show you overall traffic that comes from social networks.

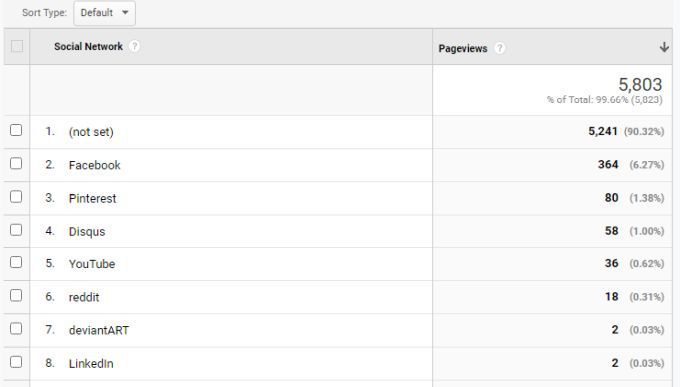
The bottom of the custom report shows a list of all social networks your traffic comes from, and how much traffic you’ve received within the time window you have selected.

The power of custom reports allows you to choose any combination of metrics and dimensions you want. Being creative with your choices can provide you with some fascinating insight into your visitors and their behavior on your site. There may be other alternatives to Google Analytics, but few provide you as much insight into your traffic.
Now that you understand what metrics and dimensions are on Google Analytics, take some time to explore them by creating your own custom reports. You can create as many as you like, with whatever combination of metrics and dimensions you want to try.