
In Part I of this series, we talked about how to open the task manager and went over the Processes, Details and Services tab. In this second part, we’re going to go over the Performance and App History tabs.
In Part III, we’ll talk about the Startup and Users tabs.
Performance Tab
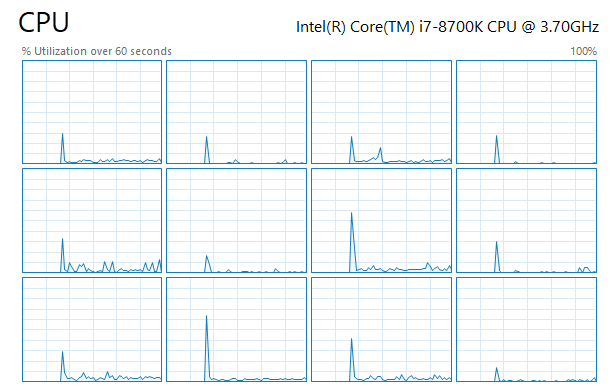
The Performance tab is probably my favorite in the task manager. It lets you see in real-time how taxed your various components are. At the top is the CPU, which will be the default selection when you click on the tab.


In the right-pane, you’ll see a graph of utilization and a lot of useful info about your processor. At the top, it’ll give you the name of the CPU, which is an Intel Core i7-8700K in my case. At the bottom and on the right, you’ll see the base clock speed, number of CPU sockets, number of cores, number of logical processors (if your CPU supports hyper-threading), whether virtualization is supported and the sizes of the CPU caches.
On the left, you’ll get the real-time utilization and the real-time speed of the processor. You’ll also see the total number of processes, threads and handles. Above, the CPU graph is showing overall CPU utilization, but if you want to see each individual core, just right-click on the graph, click on Change graph to and then click on Logical Processors.

If you click on Memory, you’ll get a graph showing how much memory is currently being used. At the top, is the total amount of memory installed on the system (32GB in my case).

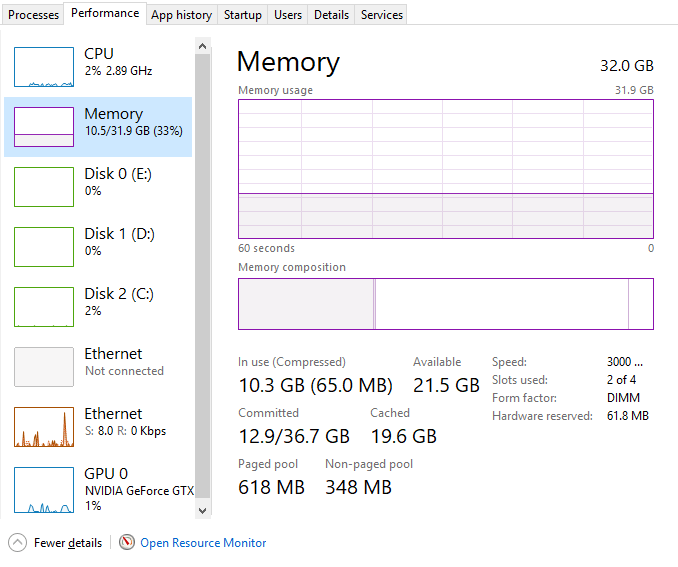
You’ll also get useful info like the speed of your memory (3000 MHz for me), how many slots are being used (2 of 4), and the form factor (DIMM). On the left is a bunch of technical details about exactly how much memory is in use and the amount of paged and non-paged memory. Check out this article from Microsoft if you want to know more about Paged Pool vs Nonpaged Pool memory.
For disks, you’ll see a graph for each hard drive you have installed on your system. In my case, I have three hard disks, so I have three graphs (C, D, E). Below is the graph for my system drive (C).

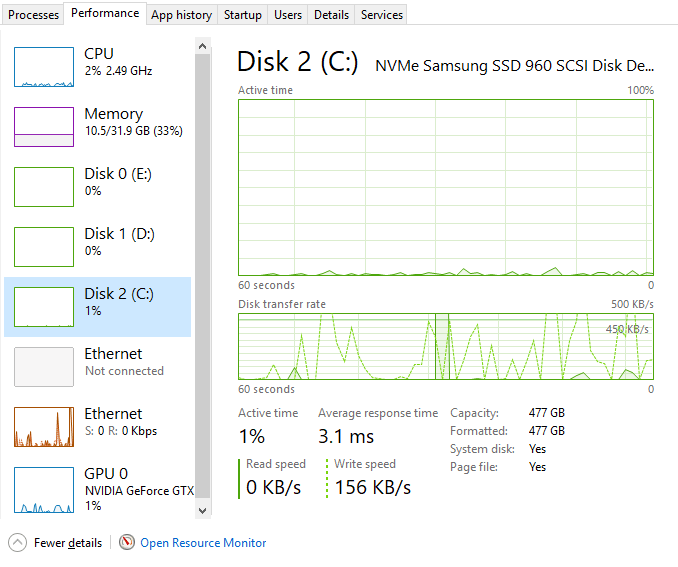
There isn’t as much info on this tab other than the disk model/brand, read/write speeds, average response time and disk size.
If you have more than one network card, you’ll see multiple Ethernet graphs too. In my case, I have two network cards, but only one is connected.

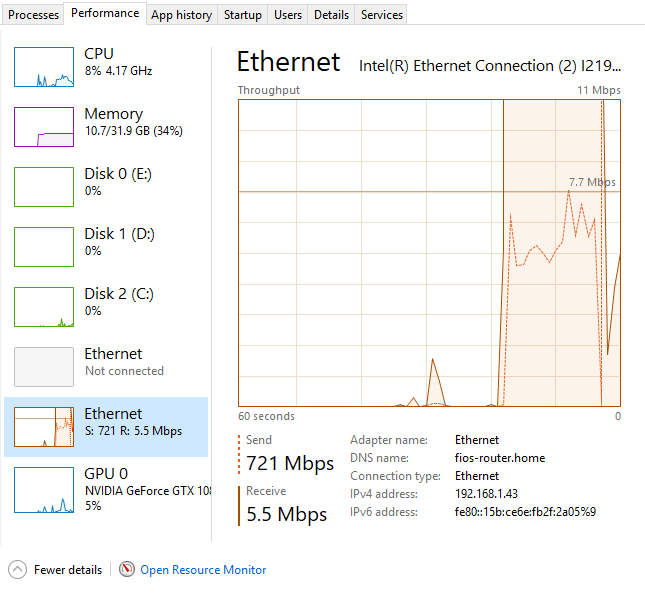
The Ethernet graphs are usually pretty bare unless you are actively downloading/uploading something. Above, I started a speed test, which was in the upload phase when I got the screenshot. Hence, the send value is at 721 Mbps. It’s worth noting that the Throughput value at the top changes depending on how much bandwidth is being utilized.
Lastly, if you have a dedicated graphics card, you’ll also see a GPU graph. If you have multiple graphics cards, you’ll get multiple graphs. The brand and model of the card will be listed at the top.

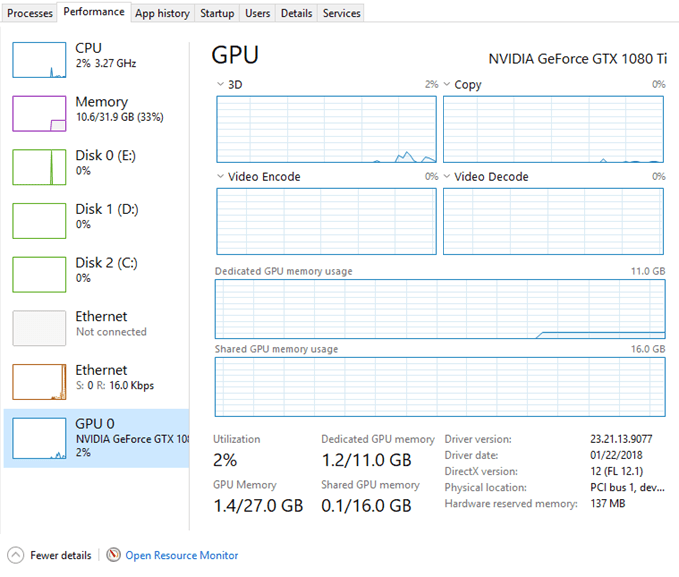
At the bottom, you’ll get info on the driver version that is installed and the version of DirectX that is supported. You’ll also get info on the dedicated GPU memory and shared memory. The graphs also break down the GPU usage by task: 3D, Copy, Video Encode and Video Decode.
So that’s a detailed look into the Performance tab. Related to the performance tab is the App History tab.


Windows 10 includes many built-in Windows Store apps and this tab will show you info about those apps and any that you install yourself. This tab is useful only to see which apps are using the most CPU or the most network bandwidth over time. Click on the column title to sort the list by that column. There really isn’t much else you can do on this tab. Right-clicking only lets you switch to the app, which will basically open it, if it’s not already open.
That’s about it for the Performance and App History tabs. In Part III, we’ll talk about the last few tabs of the task manager. Enjoy!